First, a general note about this blog. It is called “Ideas” for a reason. These are simply ideas. The work involved in generating these ideas represents about 5% – 10% of the work required on your path to profits. Do not read these ideas and immediately invest in them. Do your homework. Thanks for listening.
The market saw some interesting developments this past week. Not many were encouraging for people with long positions. I’ll touch on a couple of these. First, the major indices ramped up significantly early in the week, and fell hard at the end of the week. Second, Chinese stocks started breaking down from established patterns.
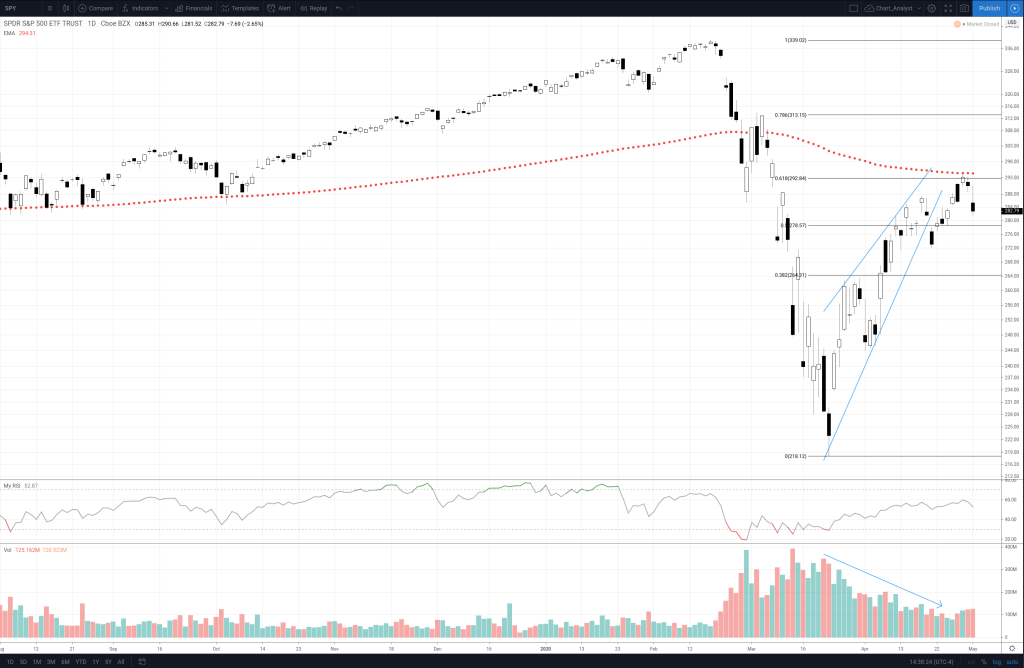
The SPY fell out of the rising wedge last week, then made a strong run up to test the 61.8% retracement and 200 day EMA. It then proceeded to drop hard on slightly higher volume. It has been one hell of a bear market rally (which is normal), but it appears to be tired. Sideways or down movement is much more likely at this point than up.
The other interesting thing of note is some Chinese stocks listed on US exchanges were exhibiting weakness at the end of the week. Before we get into the charts, I should mention how I deal with Chinese stocks. I keep about two dozen stocks on a watchlist, which is a Short-Only list. I do not take long positions in Chinese stocks. Why? The short answer is Fraud. Although the US exchanges and the SEC allow these companies to list, they do not do the due diligence necessary to protect US investors. They can’t. China regulations won’t allow them.
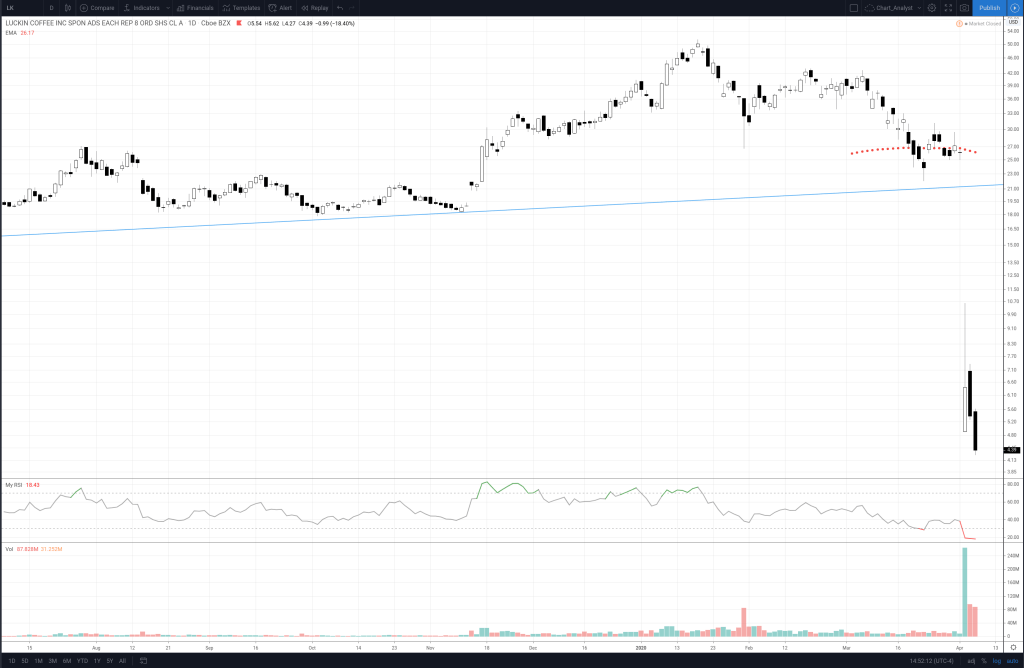
Take a look at the chart of Luckin Coffee to see what I mean. Luckin management significantly over-reported their sales and revenue numbers. When the market reacted, it eviscerated the stock. If you hold a long position, there is absolutely no defense against this kind of price movement. None. Again, NONE. You just wake up one day and see a pile of smoldering rubble. Which can represent the company or your portfolio or both, depending on if you were an investor.
If you need more information on this topic, do an internet search on “Muddy Waters Research” and “The China Hustle”. Plenty of info out there in web-land.
The other thing to note is that, given the Chinese governments propensity to prop up their market and manipulate their currency, even short positions may not be safe. So I think you get the idea now – Chinese stocks are riskier-than-normal investments.
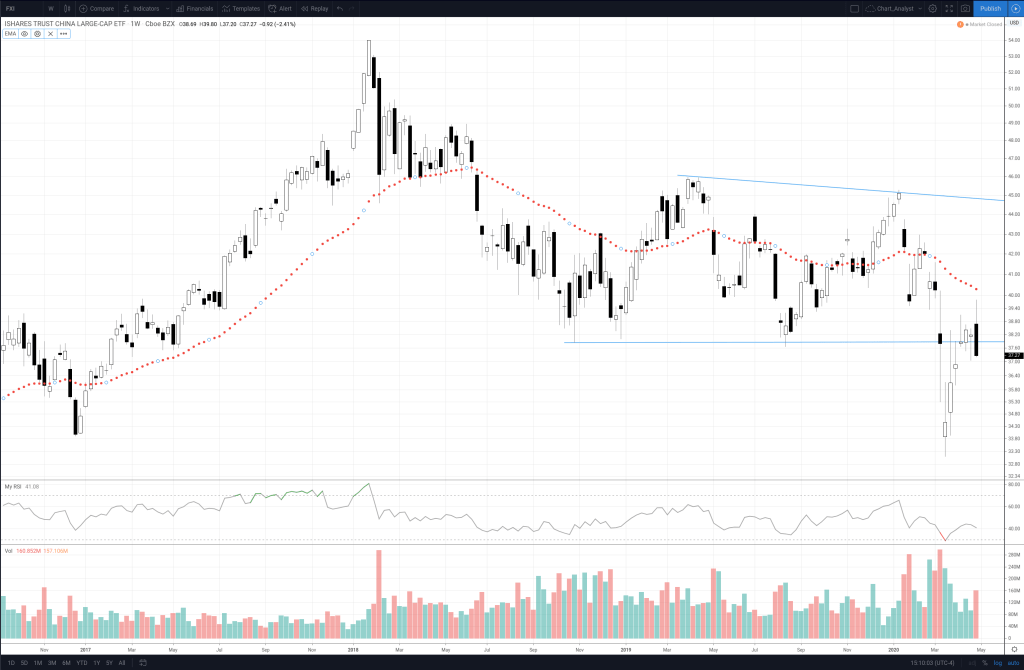
Let’s look at FXI, the iShares Large Cap China ETF. It is in a 13 month descending triangle, and has tested the lower boundary several times. Last week’s price action was very weak, and it could continue down from here.
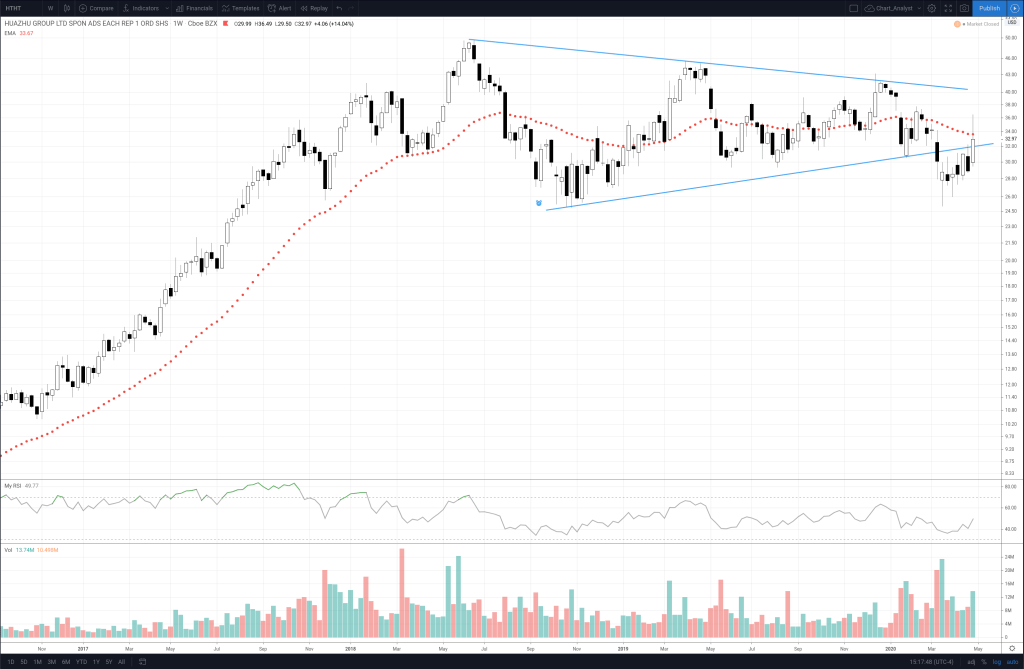
HTHT, Huazhu Group, fell below the lower boundary of a 19 month symmetrical triangle in March, and has retraced to test both that boundary and the 40 week EMA.
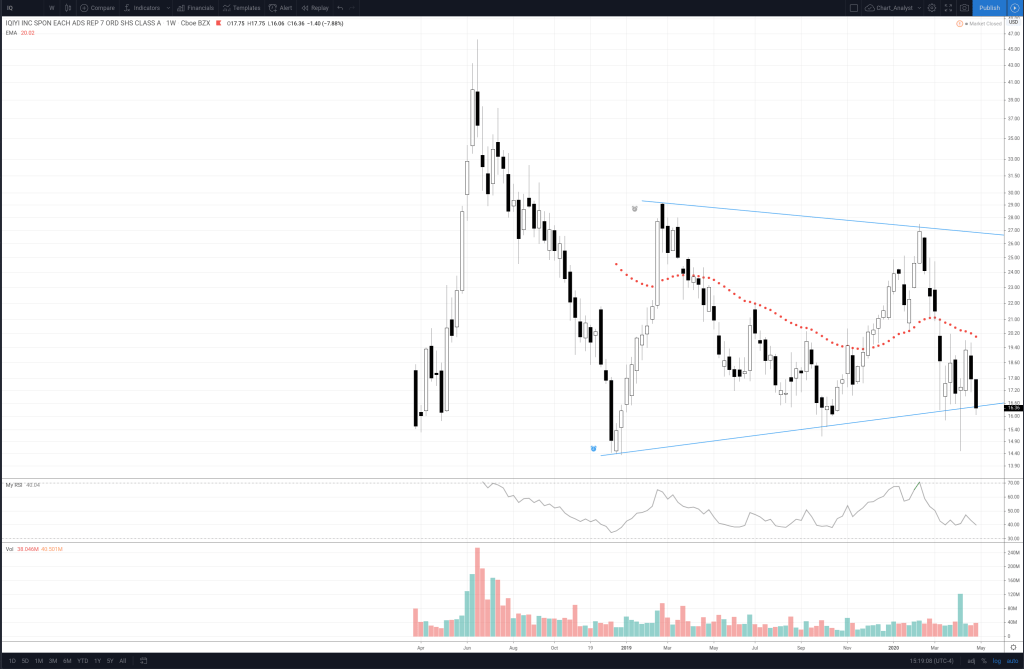
IQ, IQIYI Inc, an internet video services company, is below the 40 week EMA and is also testing the lower boundary of a symmetrical triangle.
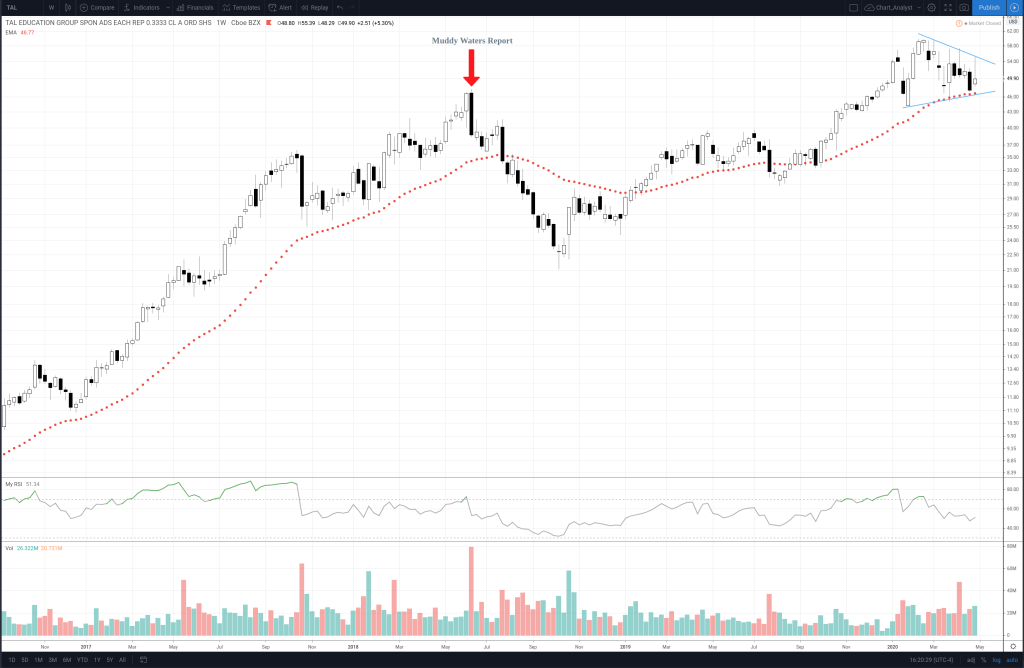
TAL, TAL Education Group, is in a 4 month symmetrical triangle and is testing the 40 week EMA. As noted on the chart, Muddy Waters Research group was short the stock in June 2018.