
“May you live in interesting times”
What to do…..what to do…..when the world is turned topsy-turvy by a pandemic and an oil price war. First of all, stay safe. Second, help where you can. Third, make lemonade from lemons, I suppose, and enjoy the low price of gasoline. Never mind that the car is sitting in your driveway, as you cool your heels under quarantine. Hey, you could still go on a long drive along some picturesque roads, and take a picnic lunch with a nice bottle of wine. Maybe some spring flowers are starting to emerge. It will get you out of the house, anyway, and won’t cost much.
Markets have definitely been flipped on their head, with most down 20% – 40% in record time. The thing to do at this point, assuming you aren’t a day trader, is to prepare for the eventual recovery. No, I don’t know when it will happen. No, I don’t know if we have hit bottom. There are multiple possible outcomes in terms of timing and magnitude. You must have a plan that will be resilient regardless of which outcome plays out. The one thing I do know is that a recovery will happen. Six Trillion Dollars being injected into the economy has that effect. Trust me on this one. The nationalization of the debt markets and the size of the balance sheet will, I guess, be someone else’s problem one day. We can only hope we’ll be gone before that chicken comes home to roost.
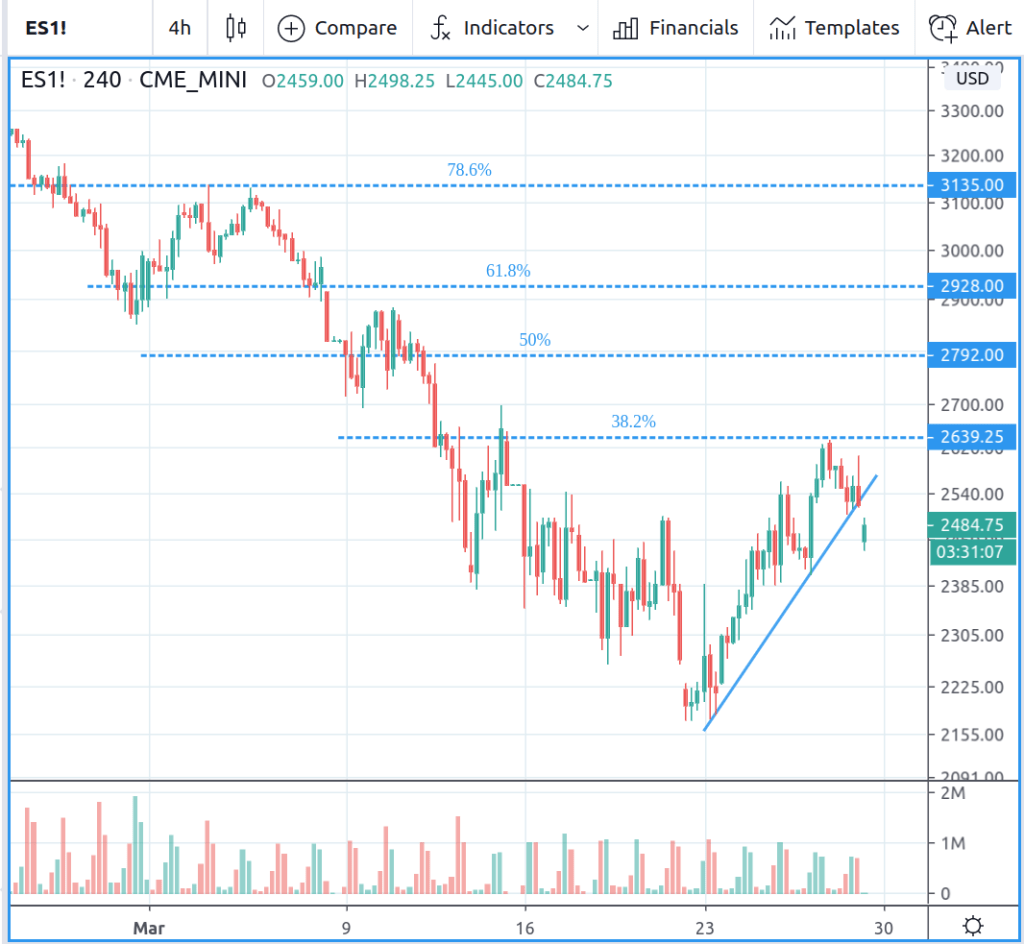
So just how is the market doing now? Here’s a 240 minute chart of the ES futures on Sunday evening March 29. Last week, the ES found a bottom at 2174 and bounced sharply up most of the week, closing at 2524. It retraced to the 38.2% Fibonacci line before falling back. Not a bad week. A fairly typical bear market rally. Time will tell if it retests the bottom now, or if it makes an attempt to reclaim 2800, which is near the 50% retracement. It gapped down at the open this evening, but it is making an attempt at recovering.
Coming back to the big picture, one way of preparing for the recovery is to determine which sectors will lead coming out of this dive. We can look at which sectors did best during the decline, and this might give us some clues as to possible future leaders. A look at relative price charts, which compare the performance of one security to another with a ratio chart, is one way to do this. In this post, I’ll compare performance of various ETFs to the S&P 500 SPY. Typically, leaders will change after going through a major drop. However, so far I see no signs of new/different leaders.
First, lets look at the major indices ETFS, QQQ, DIA and IWM.
Let’s start with the most interesting chart, the QQQ. The amazing thing about this index is it has barely broken it’s uptrend line from 2016 to present. In the big picture, it really is still in an uptrend (I know, I know, tell that to the portfolio). Even though it has dropped significantly over the past 5 weeks, it’s performance relative to the SPY has been stellar – see the upturn in the blue line, the QQQ/SPY ratio. Without a doubt it is the strongest of the major indices. Momentum investors should look at the major constituents of this index for future leaders.

This is also reflected in the strength of the Technology ETF, XLK.

The DIA and IWM, on the other hand, have both underperformed relative to the SPY.

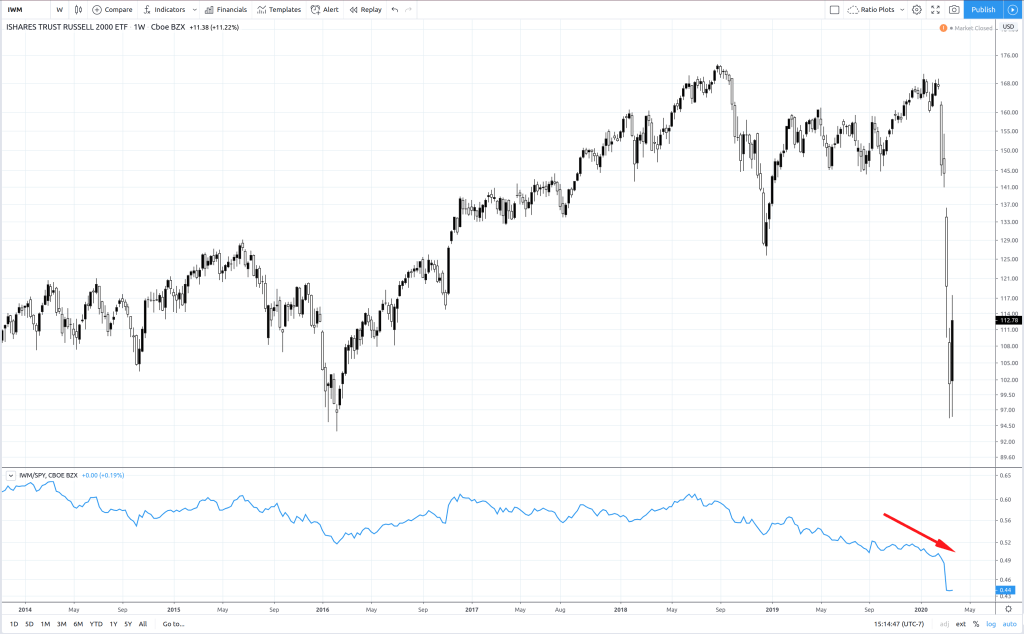
The relative performance of the QQQ vs the other indices is interesting. One could speculate that the SPY has a larger percentage of “old economy” stocks, while the QQQ has more “new economy” tech stocks. Seems logical. But this doesn’t hold water in regard to the QQQ vs IWM small caps, as there are lots of high tech small caps. The only reasoning that makes sense to me is small caps are generally seen as riskier and perform poorly in a downturn.
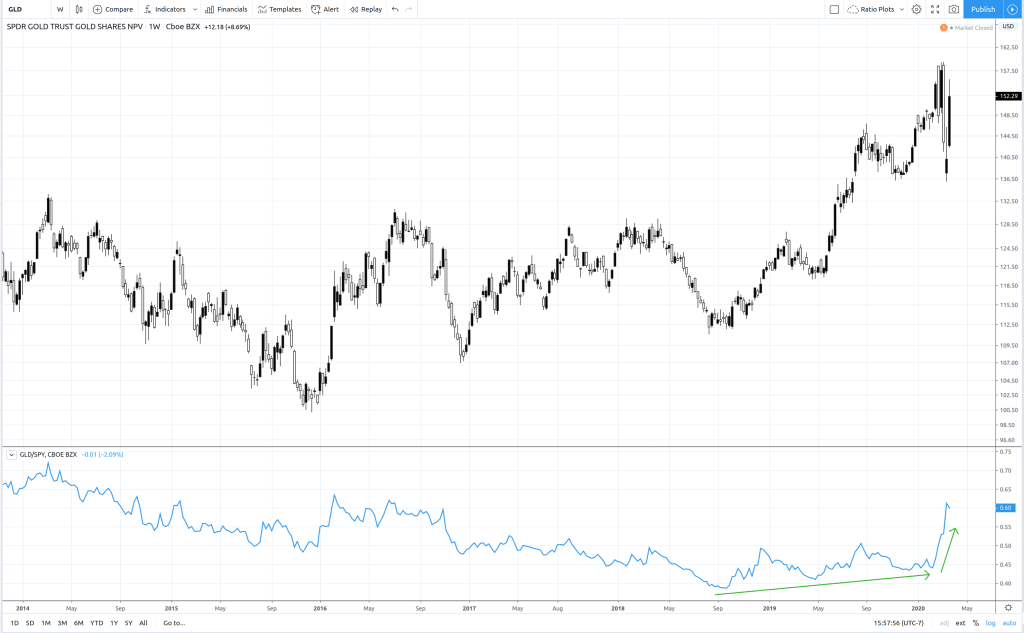
How about gold (GLD)? Gold usually does well when massive amounts of dollars (or yen, pounds, euros, take your pick) are injected into the economy. So far, this is playing out in the relative strength chart.
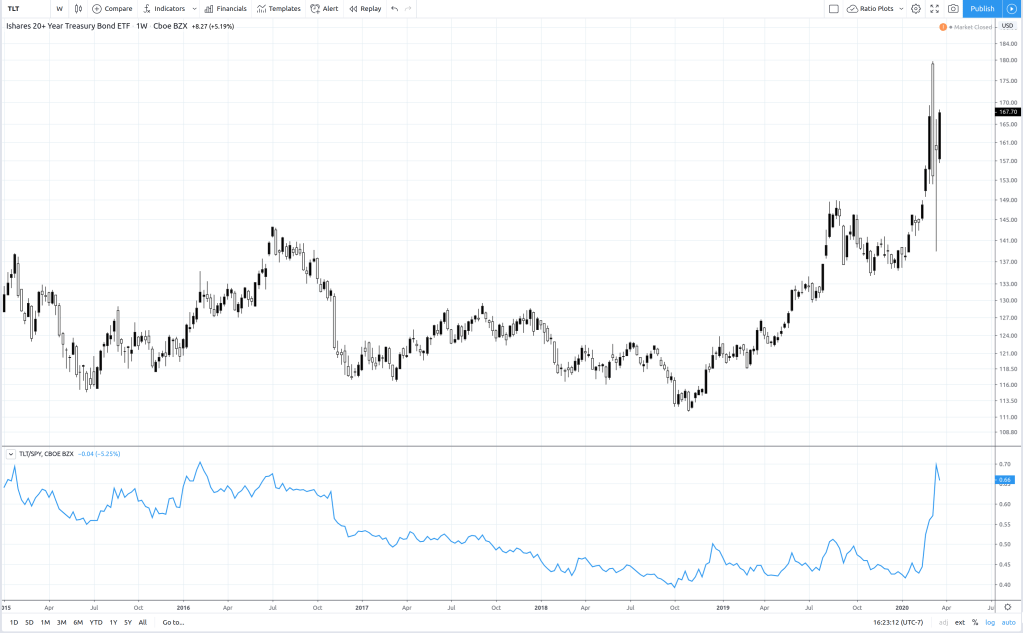
The bond ETF, TLT, is also outperforming, as you might expect.
Utilities, XLU, not so much. It’s hanging in there, but not really outperforming.

Healthcare ETF XLV has performed relatively well in both late 2018 and the present drop, but it underperformed in early 2019 during the post-drop recovery.

In summary, for the moment I look for the sectors represented by QQQ, XLK, XLV, XLP, GLD and possibly XLC (XLC relative performance is starting to turn up) to lead the recovery. Keep your focus on these sectors.
DIA, IWM, XLE, XLB, XLF, XLI, XLY, XME are relative underperformers.
XBI, XHE, XLU are performing in line with SPY. TLT? With the weird performance of the bond market lately, I’m on the fence regarding this one.
Happy Trading.
