Review
DX – The US dollar continued downward through the week and did not breach the lower boundary of the up channel – so it remains in bearish territory. It did rally on geopolitical news on Friday, but gave up most of it’s gains by the end of the day.
EUR – The Euro did extend higher early in the week, but gave up most of it’s gains and retraced to the 40 week EMA on Friday.
INTC – Advanced during the week, staying above the rectangle boundary. It pulled back on Friday with other stocks, but ended the week slightly up. The weekly candle was a spinning top, indicating indecision.
YUMC – Much like INTC, YUMC advanced during the week but then pulled back somewhat, ending the week slightly down. The weekly candle was also a spinning top, but with a black body.
VZ – Fell during the week, especially on Friday with a gap down, and closed below the upper pattern boundary. The pattern is still valid, but expect some volatility with this one.
New Ideas
ETFs
The Industrial ETF (XLI) is showing strength, especially when you consider the ETF’s reaction to geopolitical news on Friday. It was up strongly on Thursday with the rest of the market, and on Friday at the open fell with the rest of the market. But at that point XLI diverted from the market path, and ended with a significant up day. The week also ended up.
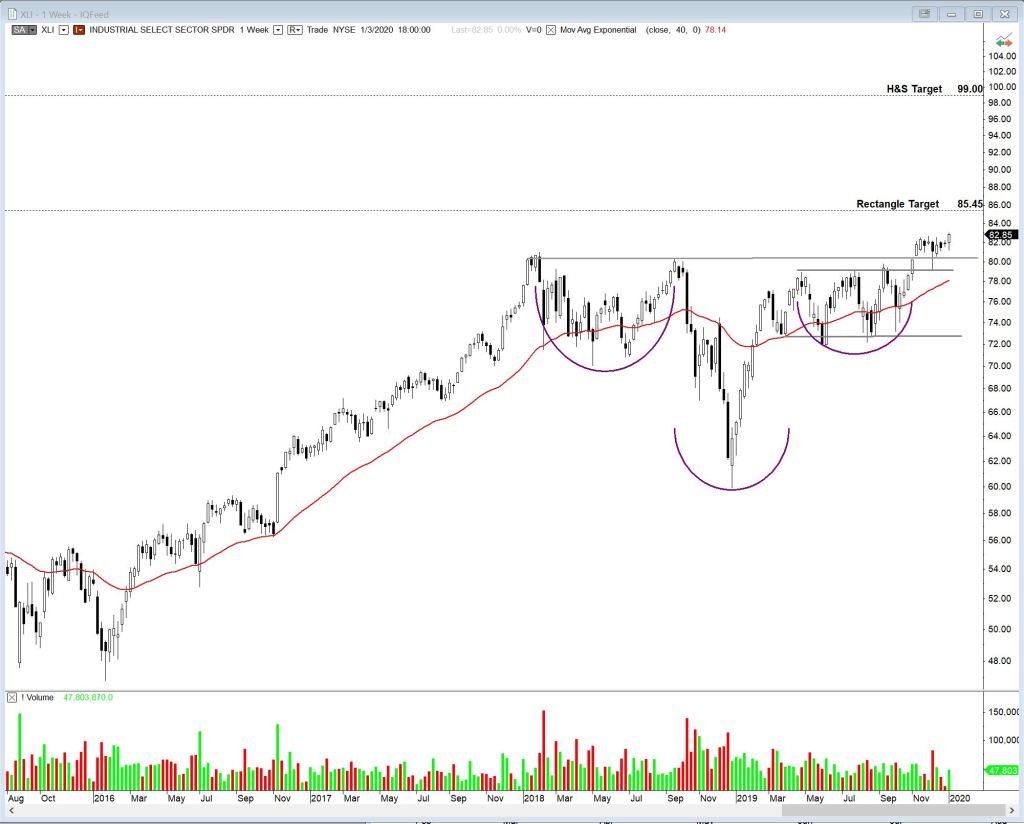
There are three interesting patterns on this chart, of which the two major ones are illustrated. First, there is a two year inverted Head & Shoulders pattern, with a possible target of $99. Second, there is a 9 month rectangle pattern with a possible target of $85.45. Price has broken out of both these patterns and appears poised to go higher. Third, there is a smaller rectangle (not illustrated) just above the neckline of the Head & Shoulders.
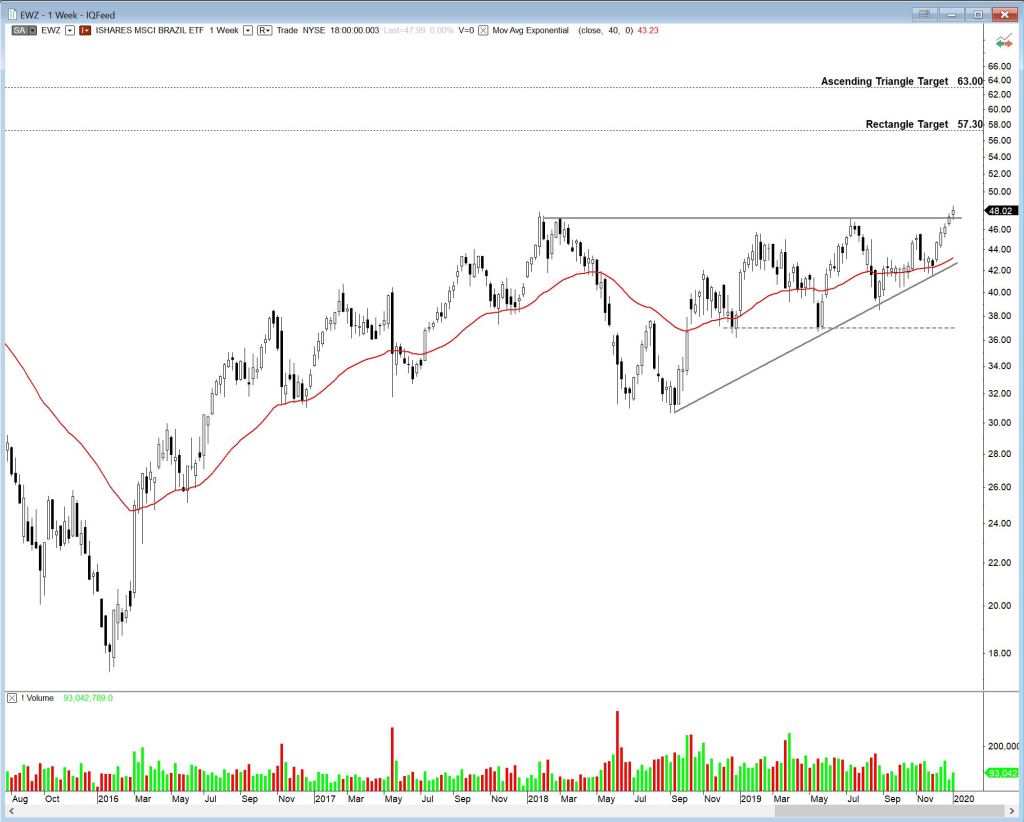
The Brazil ETF (EWZ) has broken out above the upper boundary of the pattern. The chart actually displays two possible patterns with different targets. There is an ascending triangle pattern with a possible target of 63, and a rectangle (indicated with dashed line) with a possible target of 57.30.
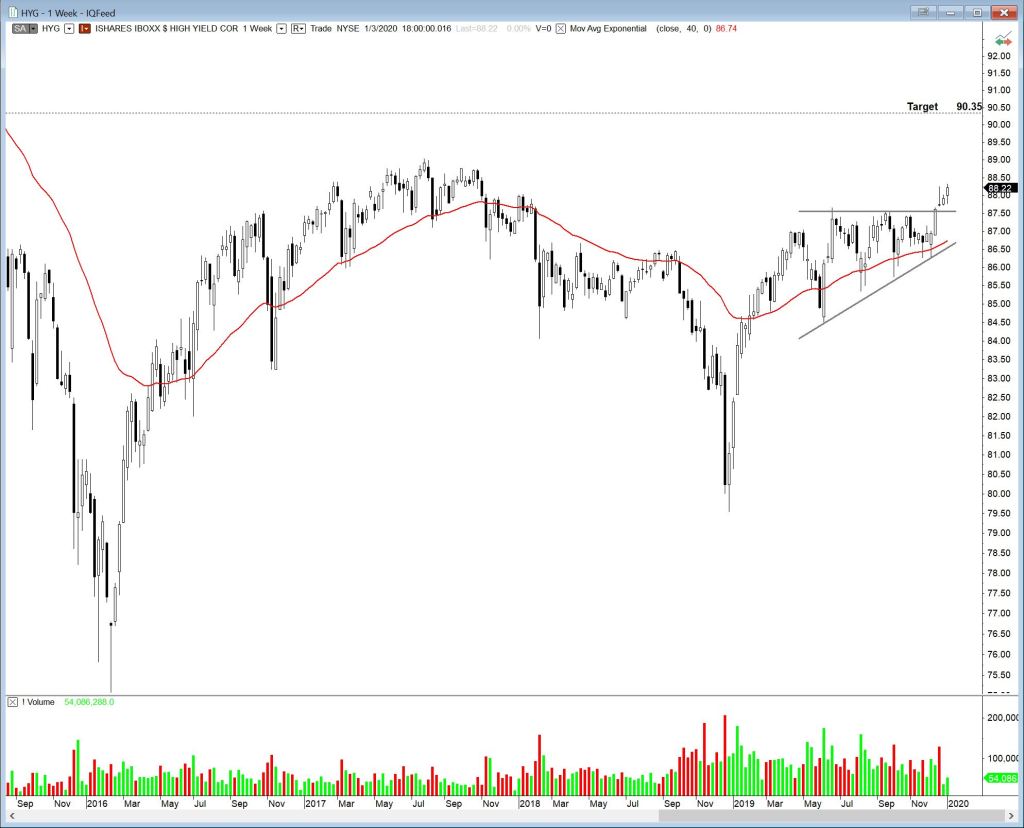
The High Yield Corporate Bond ETF (HYG), has broken out of an ascending triangle. Possible target is 90.35.
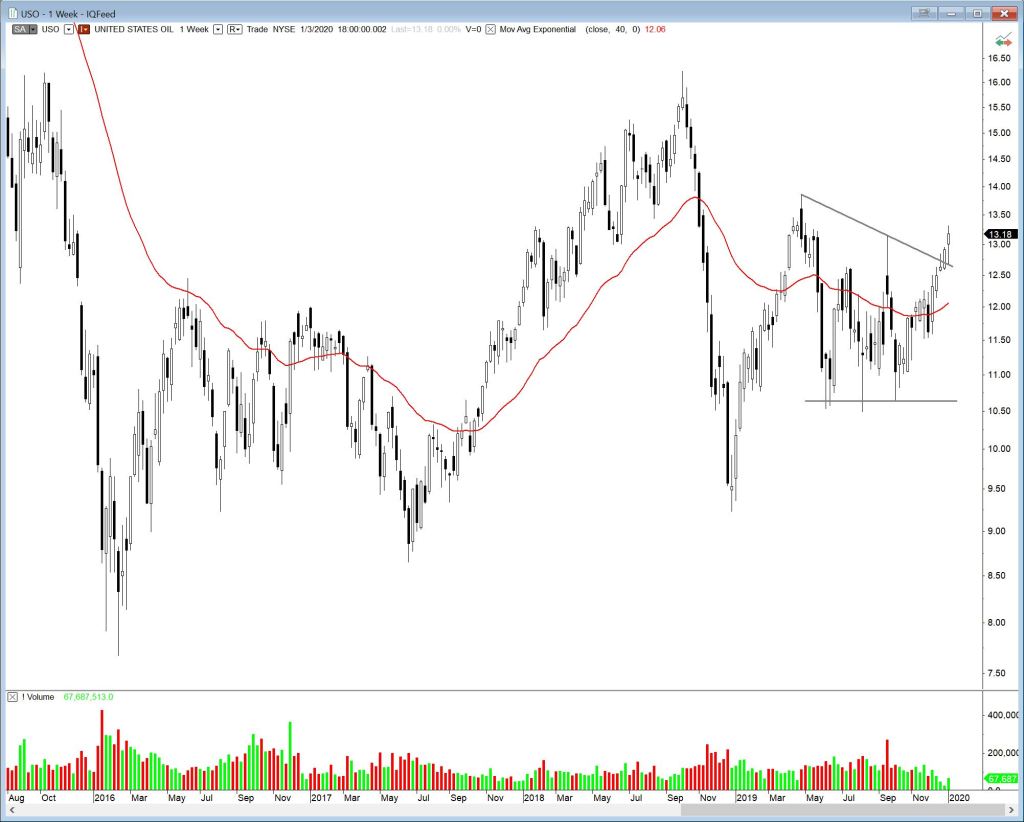
Energy, in a typical reaction, has been given a boost by the exuberant flinging of explosive devices in the Middle East. I’m of two minds regarding energy. One, short term, I think it has potential for upside under these conditions. Two, longer term, it is still saddled with the pessimistic sentiment regarding all fossil fuels. Having said that, it is breaking out, and this blog is about breakout ideas. So I present to you USO, the United States Oil ETF (UCO is similar).
Stocks
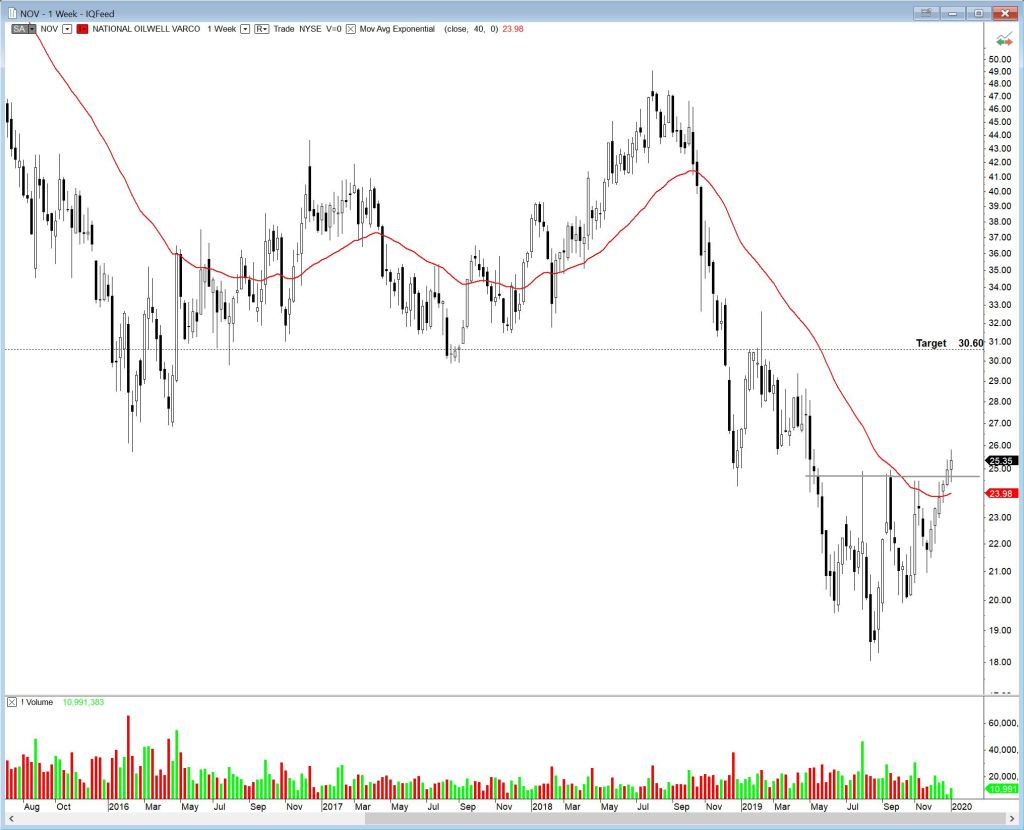
Continuing the energy theme, National Oilwell Varco (NOV) has formed an inverted Head & Shoulders pattern with a possible target of 30.60.
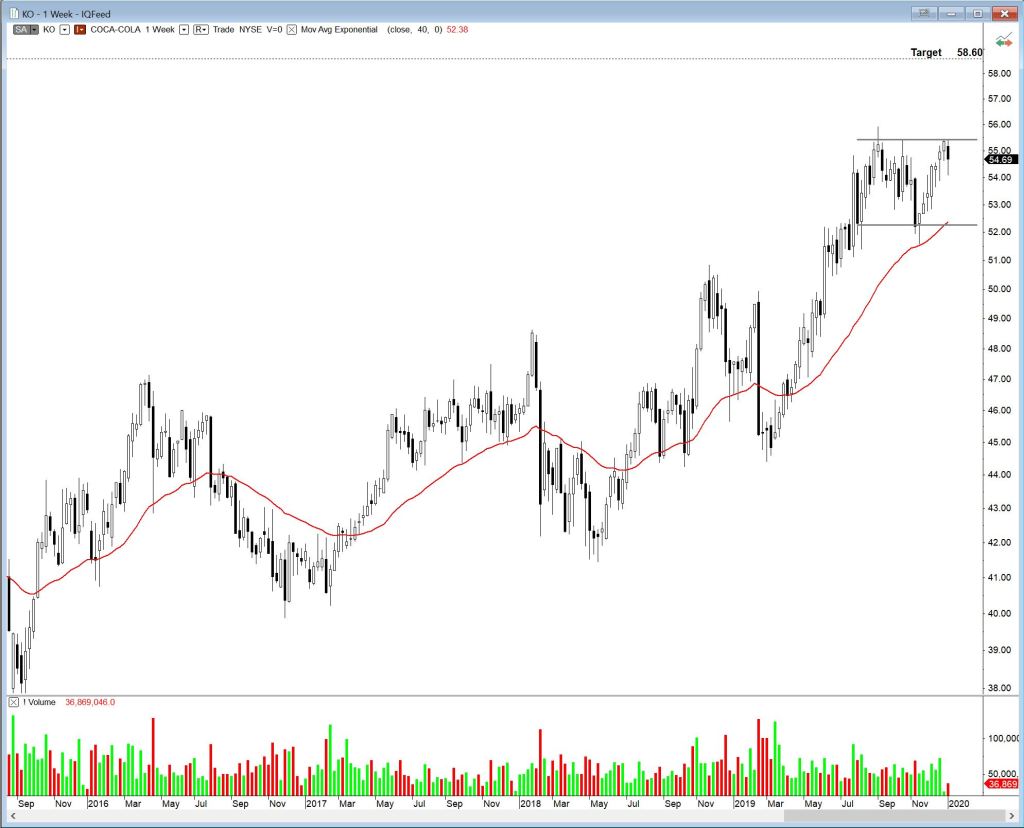
Coca-Cola (KO) is trading within a 5 month rectangle. A breakout could carry it to a possible target of 58.60. One thing to keep in mind – if there is a correction, we could see some rotation from growth to value.
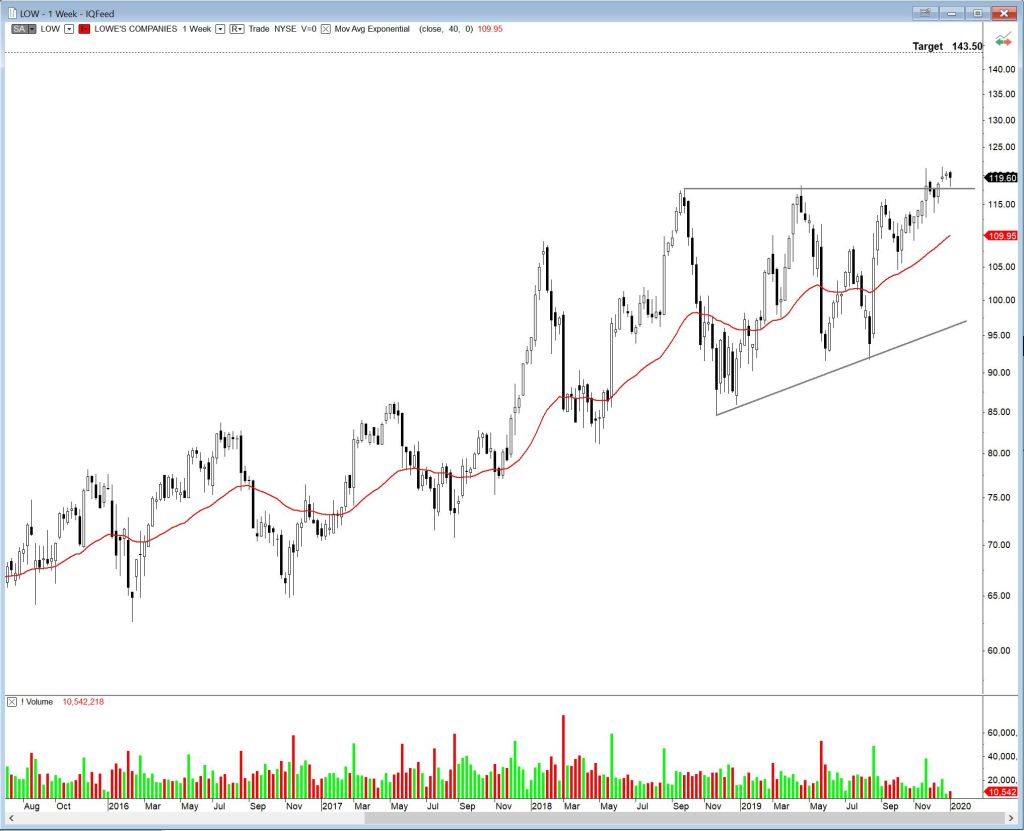
Finally, Lowe’s (LOW) has broken out from an ascending triangle and has been consolidating just above the upper boundary for three weeks. Possible target is 143.50.