Review
EWY – Nice advance by the South Korea ETF through a somewhat choppy week, most of the advance was on Friday. Volume was light as expected during a holiday week.
EWZ – The Brazil ETF is testing the top of the pattern boundary and has not “officially” broken out.
AD – The Australian dollar advanced strongly throughout the week, with significant price strength and volume on Friday.
CD – The Canadian dollar is testing the top of the symmetrical triangle, threatening to breakout.
MAT – Mattel did break out of the descending triangle, but I would not classify it as a strong breakout.
BA – Boeing has bounced off the bottom of the rectangle, but it was a weak bounce. The stock did show some life when they announced the firing of the CEO, but I would be surprised to see any optimism last. I continue to consider it a play to the downside until proven otherwise.
BIDU – Baidu occupied the week with a minor retracement to the 40 week EMA. It would be nice to see a bounce up off the EMA in the following weeks.
DE – Deere spent most of the week consolidating just above the pattern boundary.
CNQ – Canadian Natural Resources continued it’s advance, and is now testing a local high.
SU – Suncor also advanced, confirming the breakout.
XLE – The Energy Select ETF tested the top boundary of the descending triangle and retreated, confirming that this is not currently a broad-based advance in energy names. It did however, advance above and hold the 40 week EMA.
Disclosure – I currently hold positions in EWY, AD, CD, & BIDU.
Note – data from IQFeed shown in these charts is not adjusted for dividends.
New Ideas
Currencies
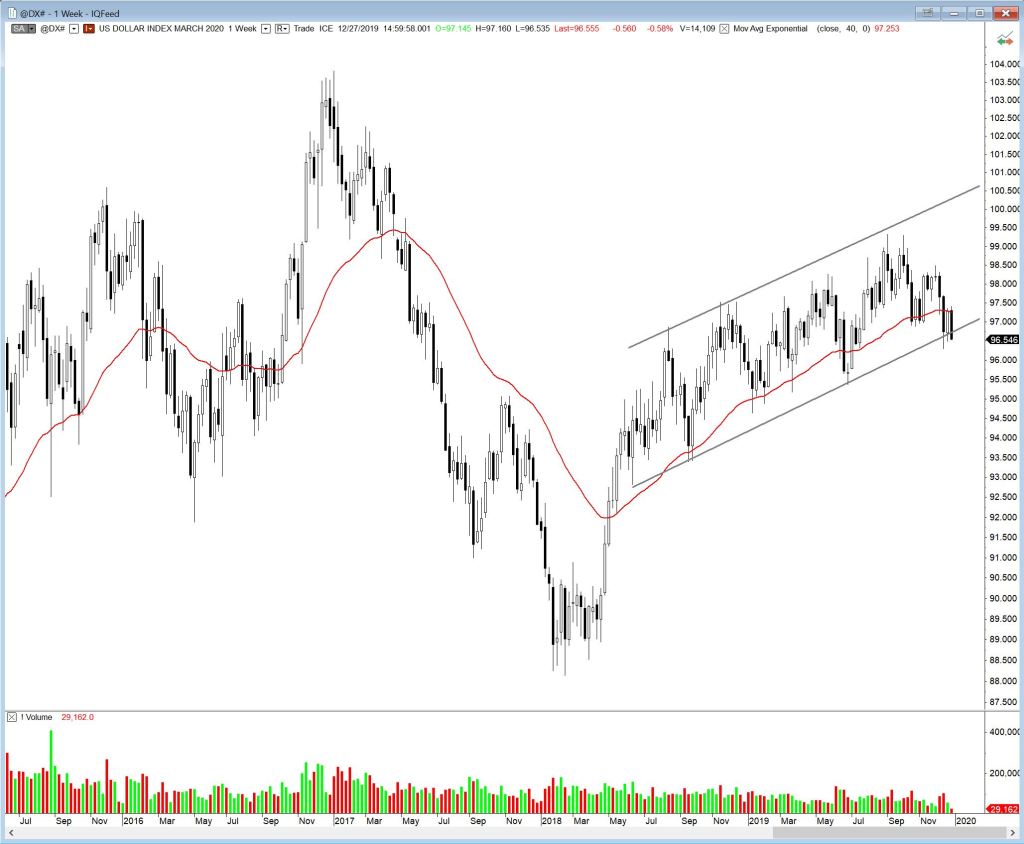
The US dollar is showing weakness and testing the bottom of a well-established channel. It was the subject of significant volatility last week, and fell sharply on Friday, moving below the 40 week EMA a second time. If this weakness continues, other major currencies and US dollar denominated commodities may advance.
The Euro is almost a mirror image of the US dollar as shown below. It has been in a downward channel, but is testing the upper boundary of the channel and has closed above the 40 week EMA. There is also a ascending triangle within the channel, from which it has broken out.
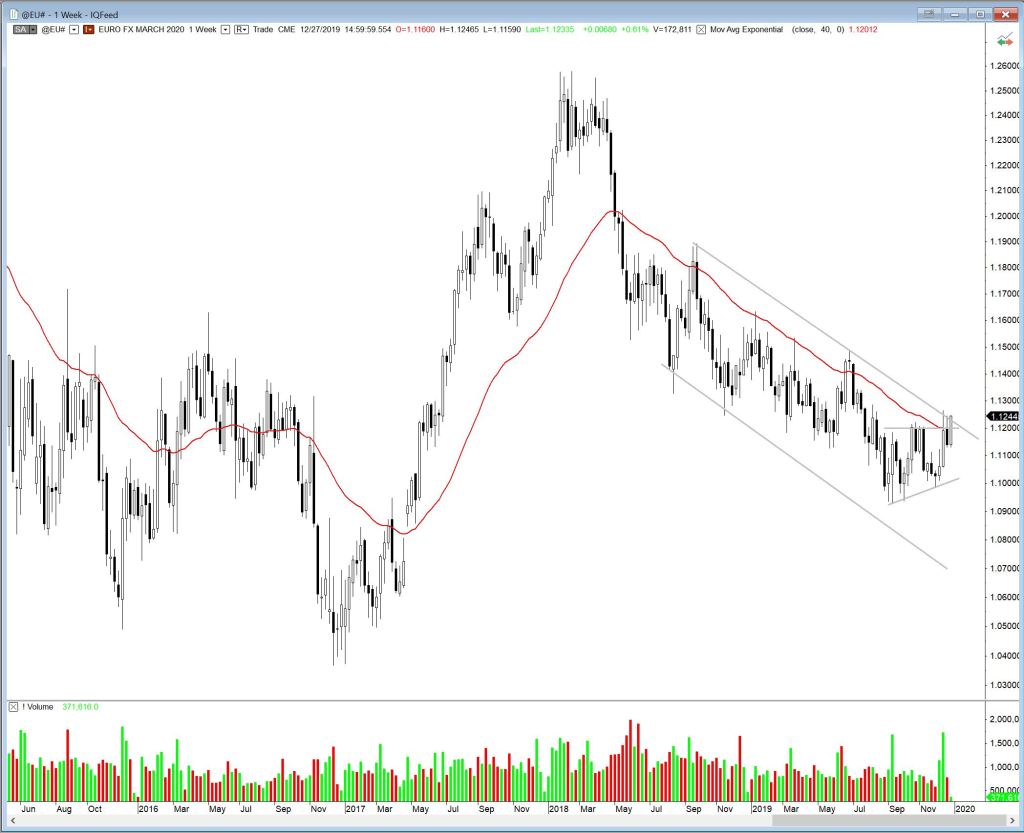
I should mention that I do not trade upward/downward sloping channels – the only channel that I trade is a rectangle. But the developments in the charts shown above are interesting, indicating possible trend changes, and may develop into what I consider trade-able patterns. I do consider the ascending triangle in the Euro chart as a trade-able pattern, but it has to deal with resistance presented by the sloping channel.
Stocks
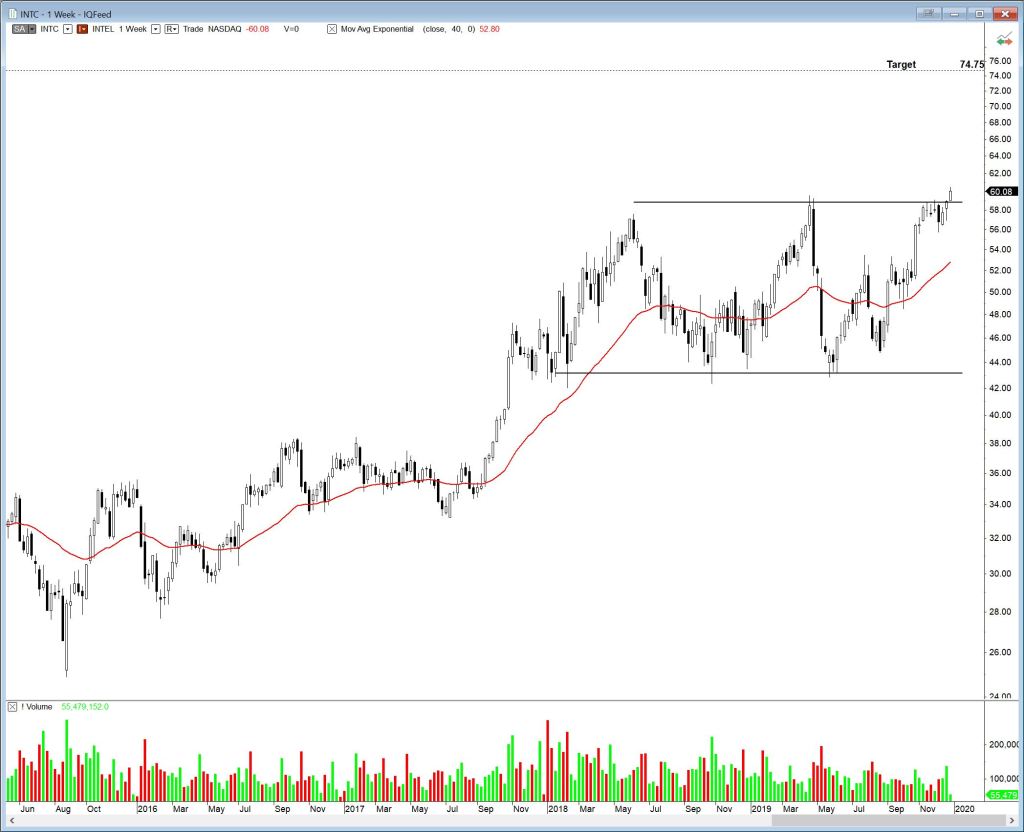
Intel (INTC) has broken out of a well-defined 18 month rectangle. Price challenged the upper boundary for 7 weeks before breaking out. Possible target is 74.75.
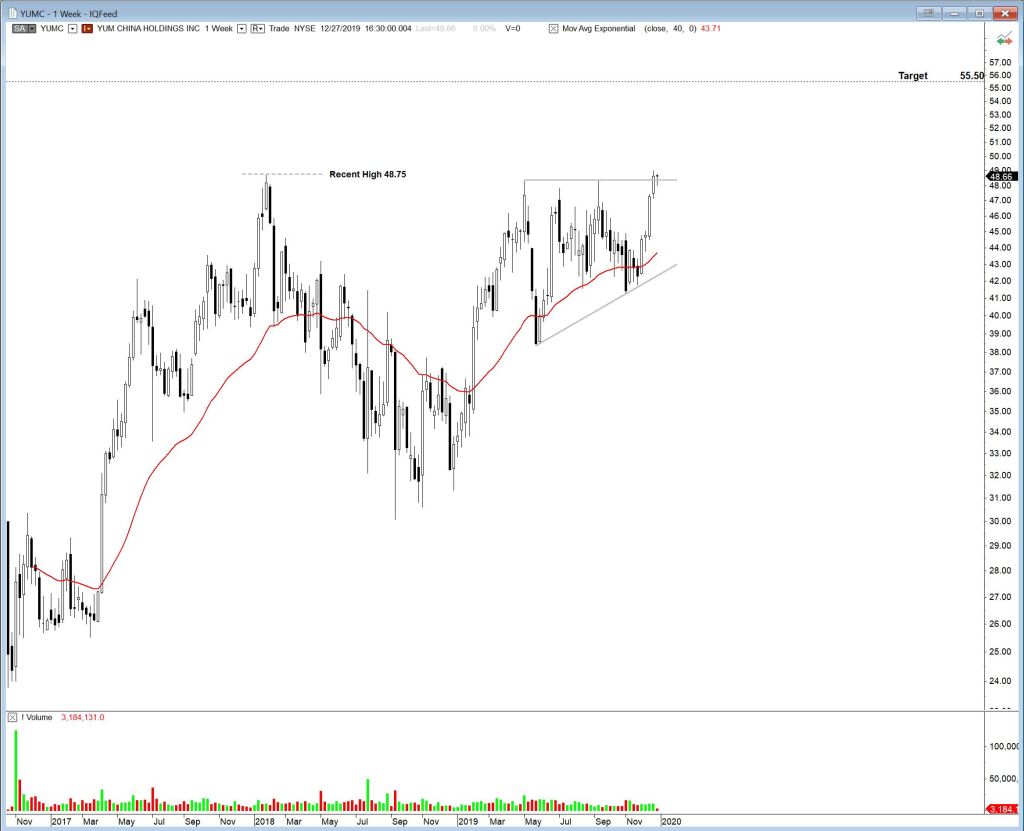
YUM China Holdings (YUMC) has broken out of an ascending triangle that has a possible target of 55.50. While price has broken out, the January 2018 high of 48.75 still remains as resistance and needs to be cleared.
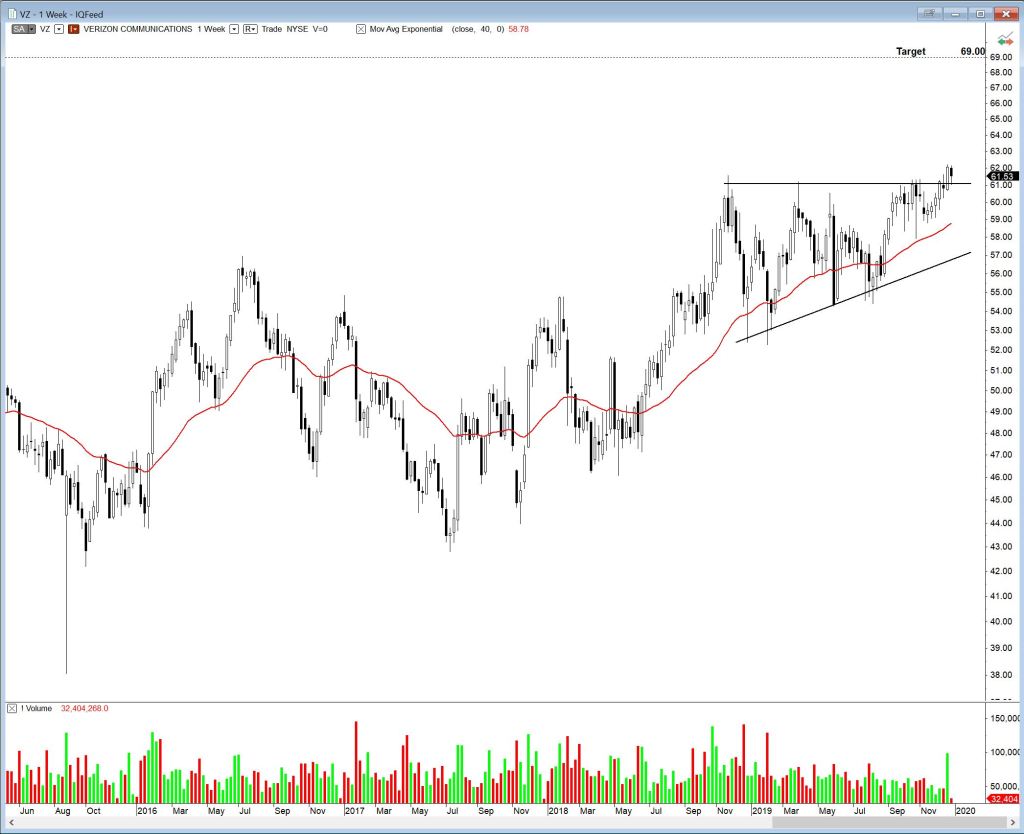
Verizon Communications (VZ) broke out of an ascending triangle 2 weeks ago, then retraced back to support and bounced a little last week. Possible target of 69.00.