Review
First let’s review the charts from last week to see what transpired. The review is discussion only, no charts, otherwise this thing gets to big to plow through.
EEM – Made scant progress during the week, trading in a range from 43.82 to 44.67, closing slightly higher than the prior week. Breakout pattern is still valid.
FXI – Ditto. Trading range was 42.26 to 43.21, with a higher close than the prior week at 43.12. Breakout pattern is still valid.
RSX – Advanced nicely, slow grind up all week, to close at 26.00 even.
CL – Crude is still testing the upper boundary of a descending triangle, has not made a clean breakout.
RB – Gasoline has broken out of an ascending triangle and closed the week at 1.7058, narrowly above the 40 week EMA. Haven’t a clue if it will hold or if it’s a fakeout. Seasonality says tread carefully.
HG – Copper has made a clean breakout, but highs this week did not aggressively clear the prior week’s high. Pattern is still valid, but it did a lot of consolidating this week.
FCX – Started the week strong but then drifted down throughout most of the week, ending the week with an extended black candle on Friday. It may see a pullback to support before continuing. Pattern still valid.
AUY – Yamana tested the top of the rectangle and retreated. It seems a breakout is not imminent, and it may test the bottom of the rectangle and the 40 week EMA again.
PYPL – Paypal broke out cleanly with a gap up on Monday of the past week. It then tested support and bounced weakly. The weekly candle formed a spinning top, representing indecision. Pattern is still valid.
New Ideas
There is one overriding theme in the charts I looked at this weekend. Up. Note that SPY and QQQ have reached pattern targets (those have not been charted here, but I wanted to point that out), and may be due for consolidation or correction. Drilling down a little (forgive the pun) some energy names look interesting. Yes, I actually see some energy in energy names, believe it or don’t. Is it bottom fishing? Yup. I’ll also review a few international ETFs and a couple of currency futures.
Emerging Markets
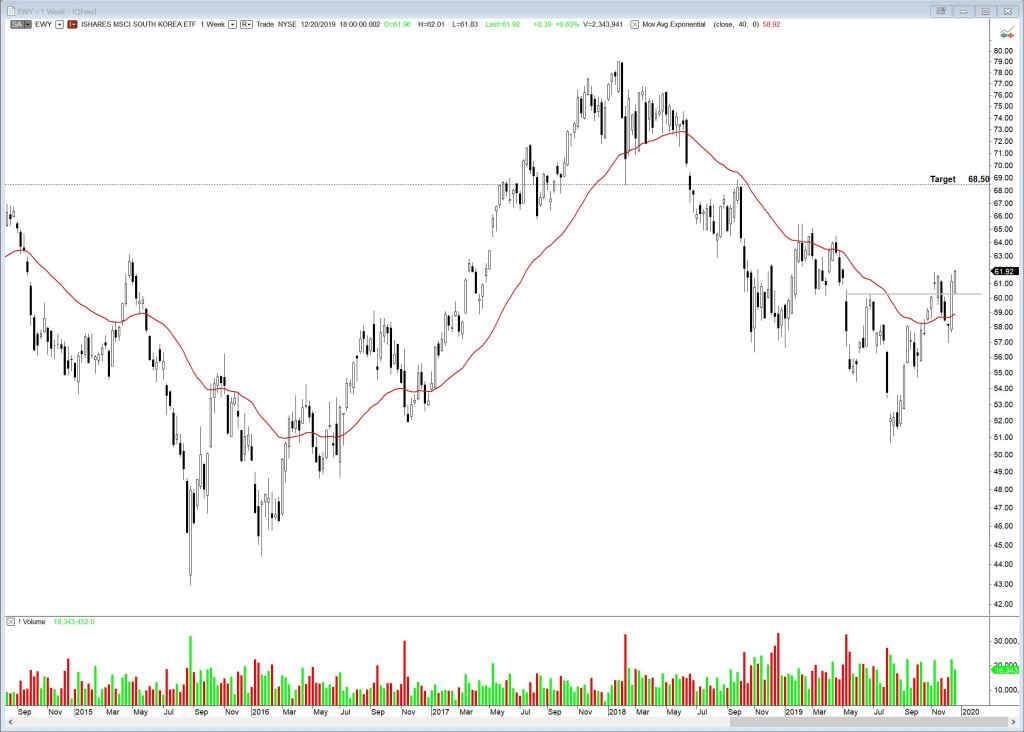
Internationally, FEZ, EEM, EFA, EWJ all continue their march upwards. As far as trades go, they are too extended in their current patterns to jump in now, but there are others. Emerging markets EWY and EWZ stand out for potential breakouts. MSCI South Korea ETF, EWY, has formed an inverted Head & Shoulders pattern (right shoulder is a bit messy, but I still like it), broken out above the 40 week EMA, retraced, then advanced strongly the last 2 weeks. Possible target is 68.50.
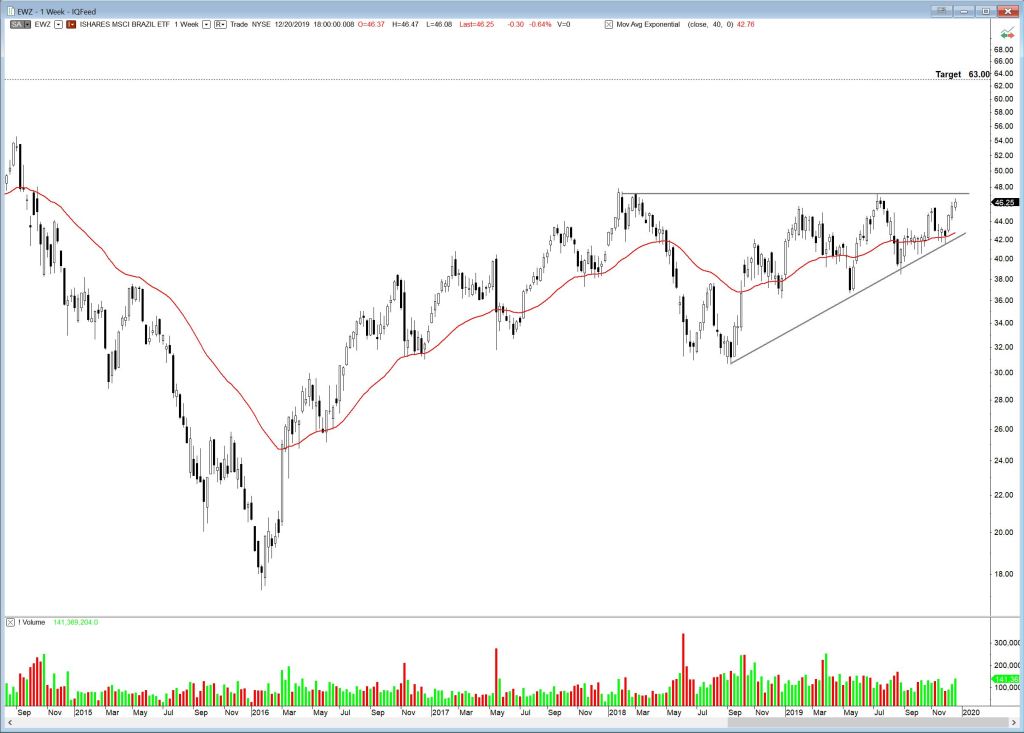
MSCI Brazil ETF, EWZ, is in a 22 month ascending triangle and is within testing distance of the upper boundary. One to watch. A breakout could advance to a possible target of 63.00.
Currency Futures
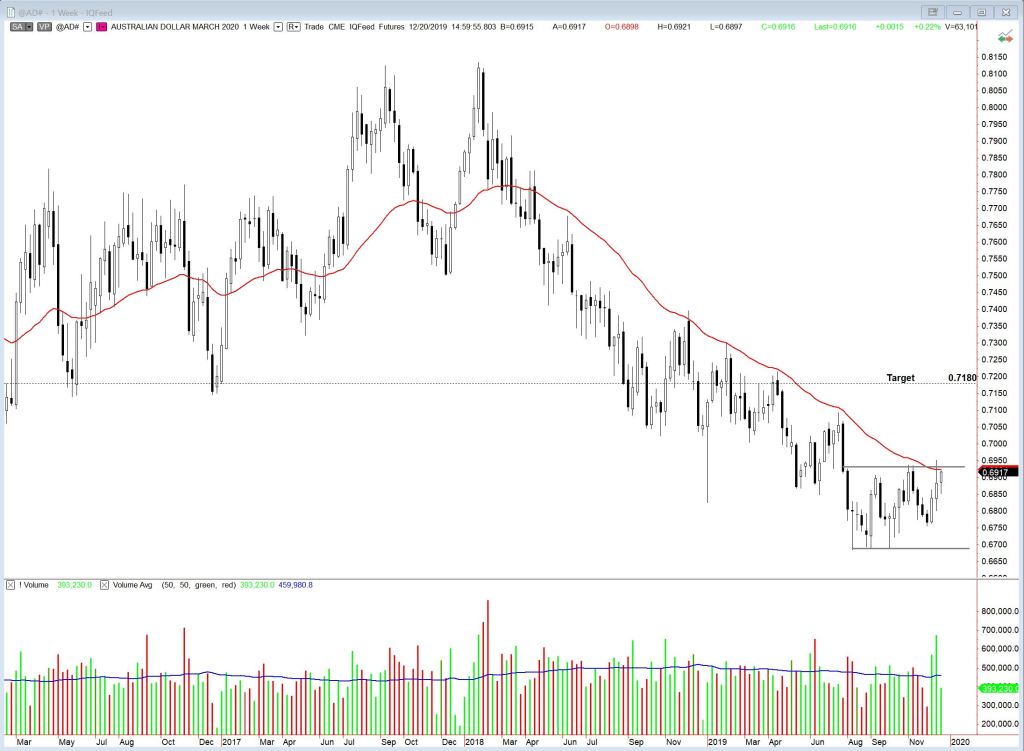
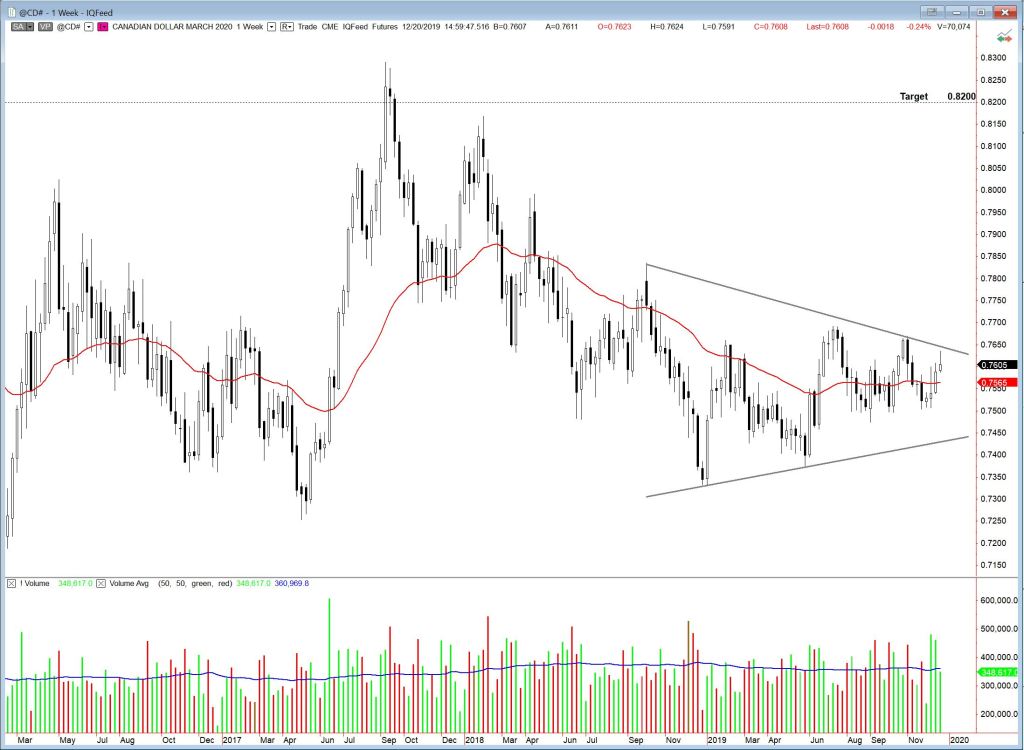
The Australian and Canadian dollar futures charts are forming rectangle and symmetrical triangle patterns, respectively, and could be poised for a breakout. Both are rooted in commodity-based economies, and could be sending a message regarding where we are at in the commodity cycle. $AD_F needs to clear the 40 week EMA before a position is initiated, and both need to clear pattern boundaries.
Stocks
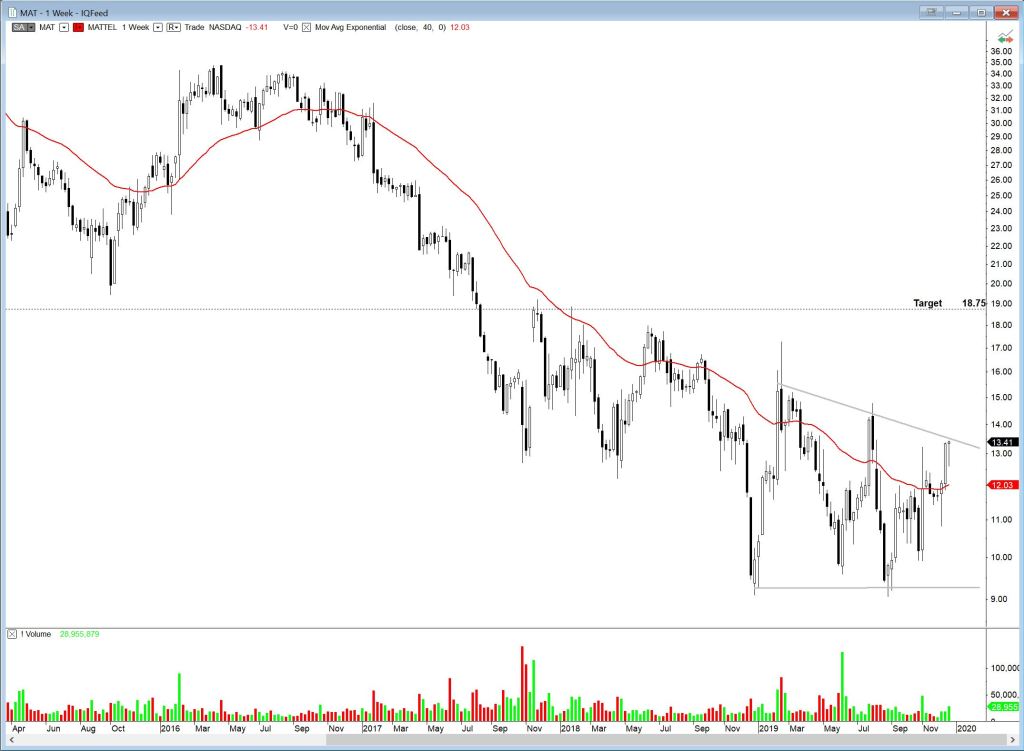
What’s Christmas without toys? Bah humbug, for sure. But no worries, here is a holiday season chart that could cheer you up. Mattel Toys, MAT, is challenging the upper boundary of a descending triangle. If it breaks out to the upside, target is 18.75.
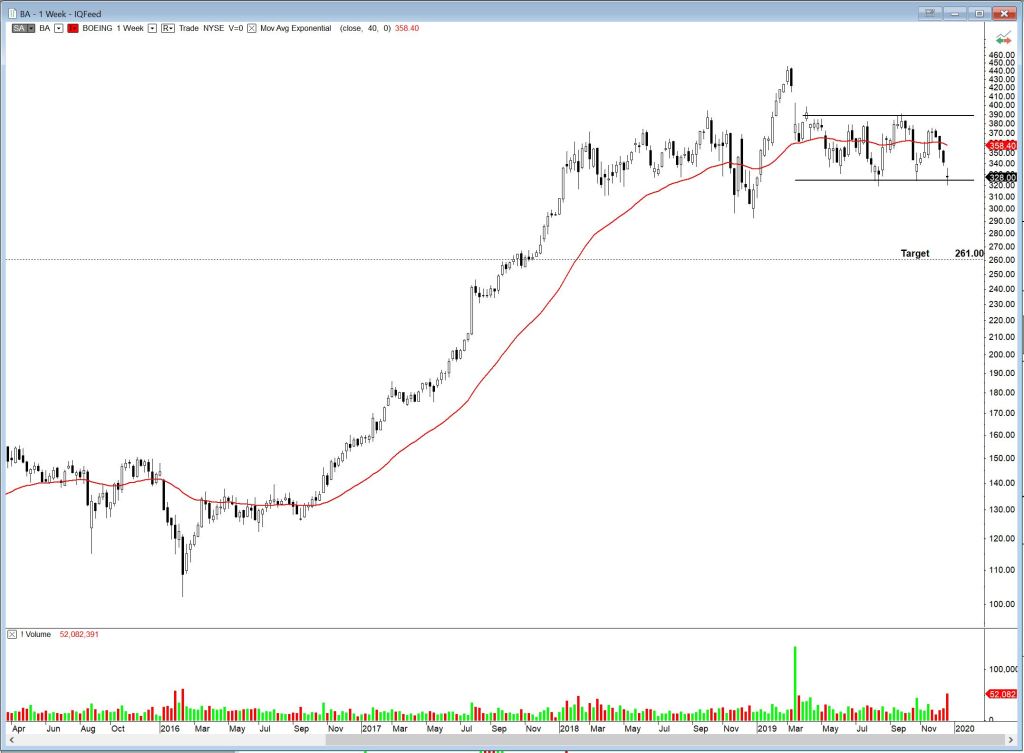
On a more somber note, there actually is a stock or two that are fighting the tape and going down. Boeing, BA, for one. It is trading in a well-defined range and a downside breakout could yield a target of 261. This week’s candle formed a doji at the base of the rectangle.
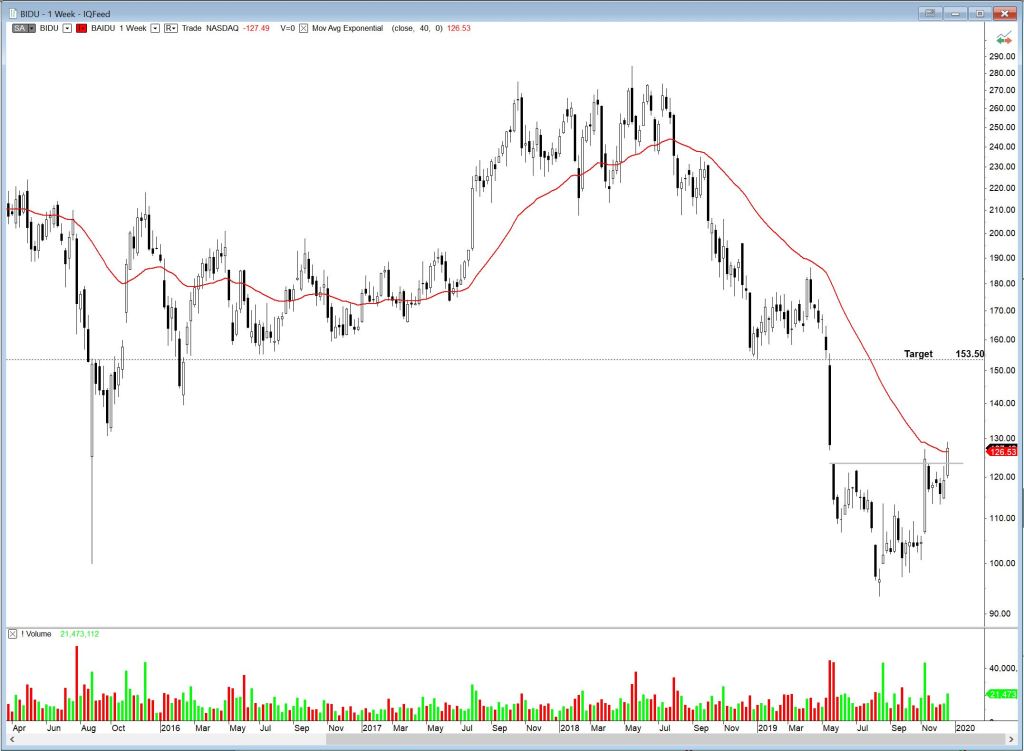
Baidu Inc ADR, BIDU, is a bit beaten up but could be ready for a turnaround. It has formed a possible reversal pattern, an inverted head and shoulders. The gap from May has been tested twice now and we want to see it continue up rather than retracing a third time. It is trading just above the horizontal neckline and above the 40 week EMA. Upside target 153.50.
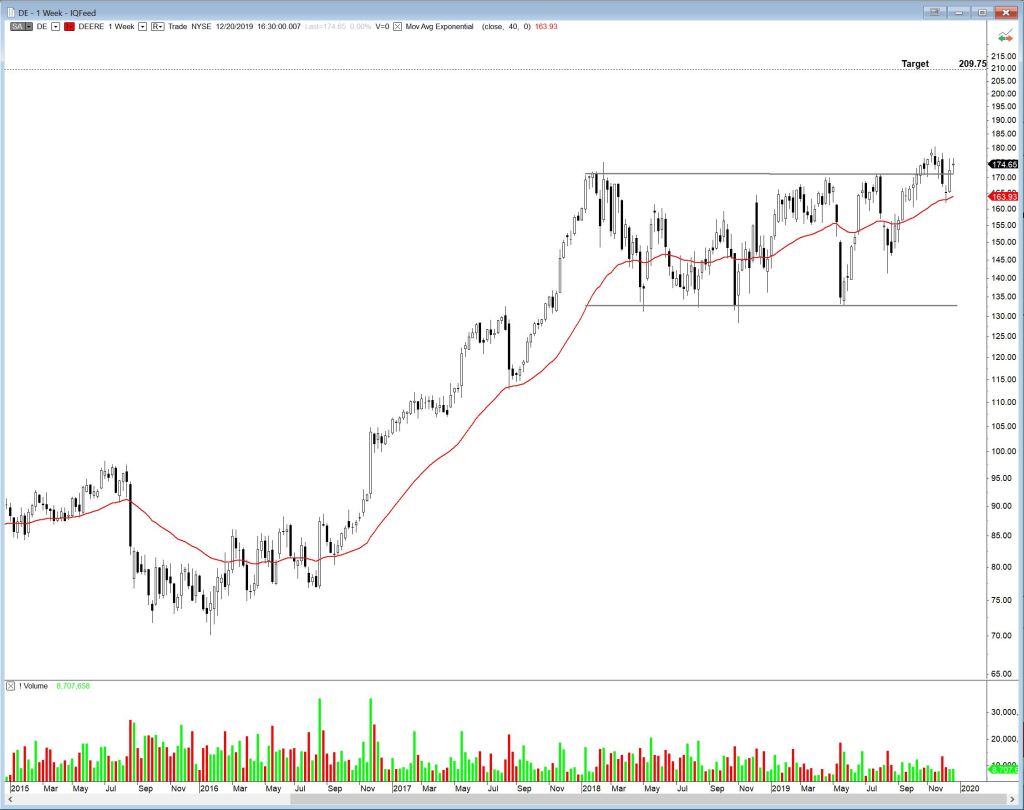
Deere, DE, has been in a rectangle trading range since early 2018. It broke out in October of this year, but stalled and retraced back inside the range to the 40 week EMA. It has broken out again, but needs to accelerate to clear congestion.
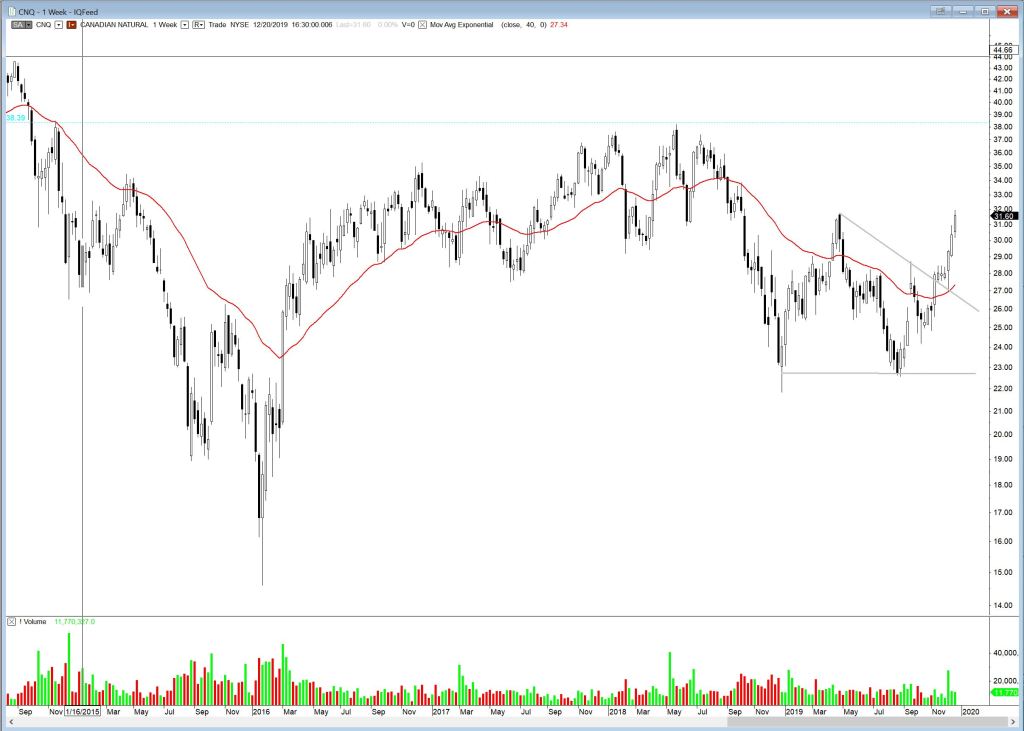
Just to prove that I’m not hallucinating regarding energy names, I’ll start with an energy company that has actually broken out and moved up. Canadian Natural Resources, CNQ. Price has broken out of a descending triangle and moved up strongly to test a local high.
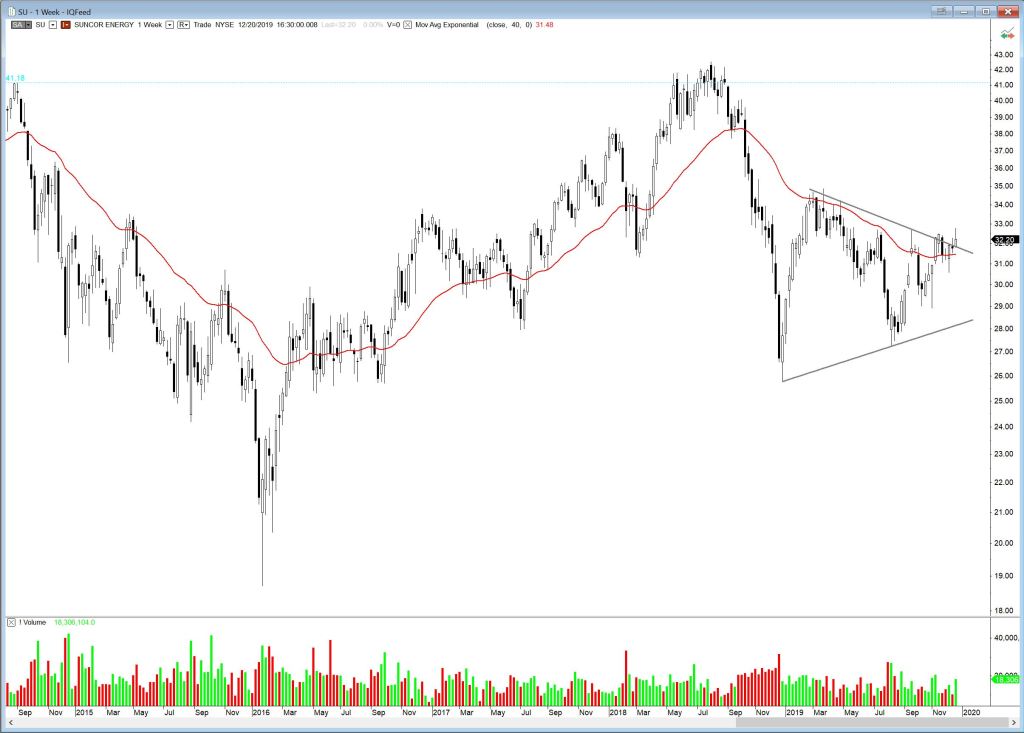
Suncor, SU, is testing the upper boundary of a symmetrical triangle. It’s a bit more subdued than CNQ, but a breakout could result in reasonable upside.
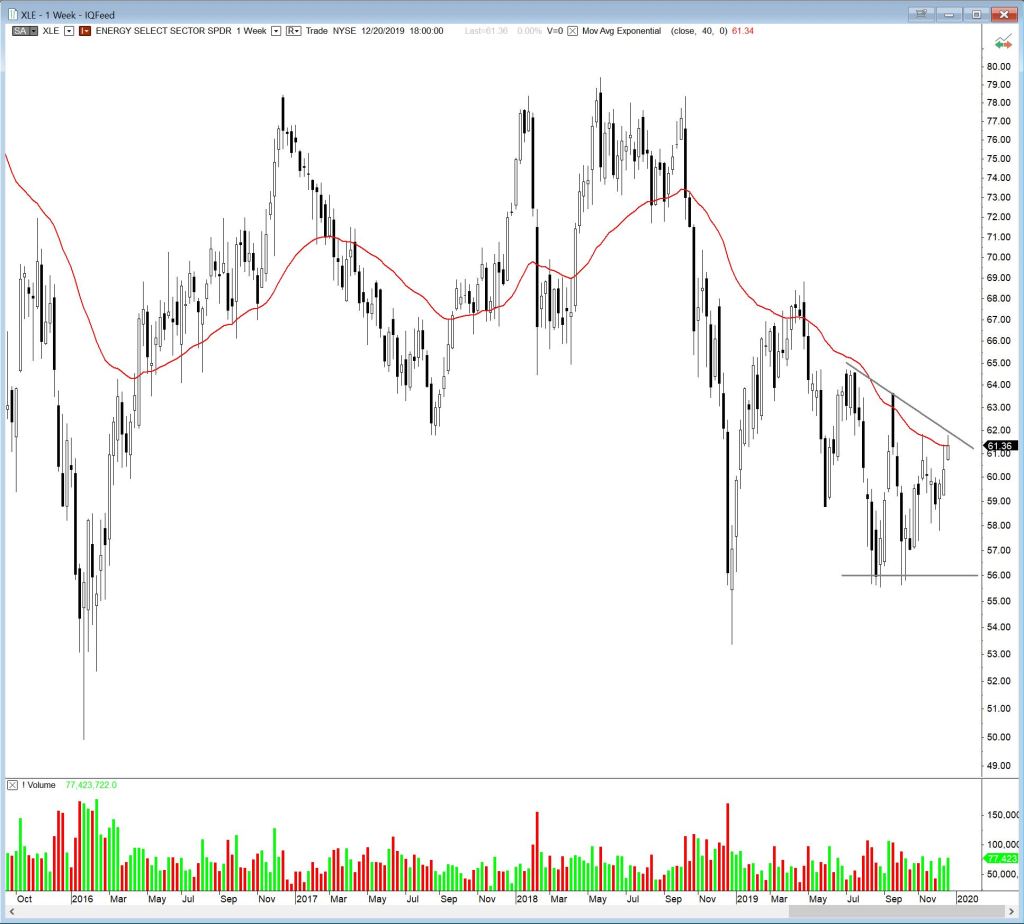
But the energy rally has yet to see broad participation, so be careful. Energy ETF XLE is still stuck between the boundaries of a descending triangle, just below the 40 week EMA.