Please note this blog is still under initial construction. To view images full size, please right click the image and select “Open image in a new tab”.
Emerging Markets
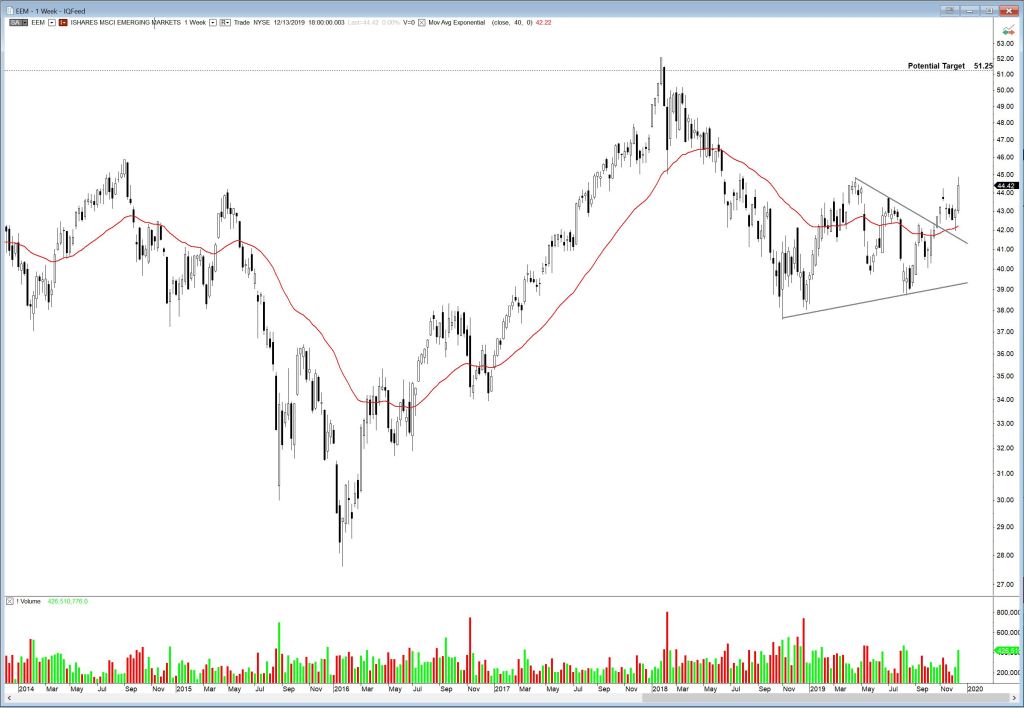
Since this blog was designed to focus on US stocks and ETFs, I’m going to lead off with, of all things, emerging markets. I suppose it’s a lesson in “be careful how you describe your blog”. Fortunately the emerging markets are well represented via US-based ETFs. First up is the EEM, the MSCI Emerging Markets ETF.
EEM broke out of a triangle the week of October 25 2019, so it isn’t exactly news that it is moving. You’ll forgive me if I cherry-pick a bit on my first blog entry. Last week it retraced to the 40 week EMA and then bounced up to 44.42 to end this week. Possible target from the triangle is 51.25.
Next, the Chinese FTSE 25 ETF, FXI. It is attempting a breakout from a descending triangle. I hesitate to put a target on this one, as its future path will be highly influenced by the wildly fluctuating whims of the Tweeter-in-Chief. Tread carefully. Note that descending triangles are typically bearish patterns, although they can also be reversal patterns in some cases. If/when price does break out to the upside, it often encounters resistance at the dotted lines on the chart.

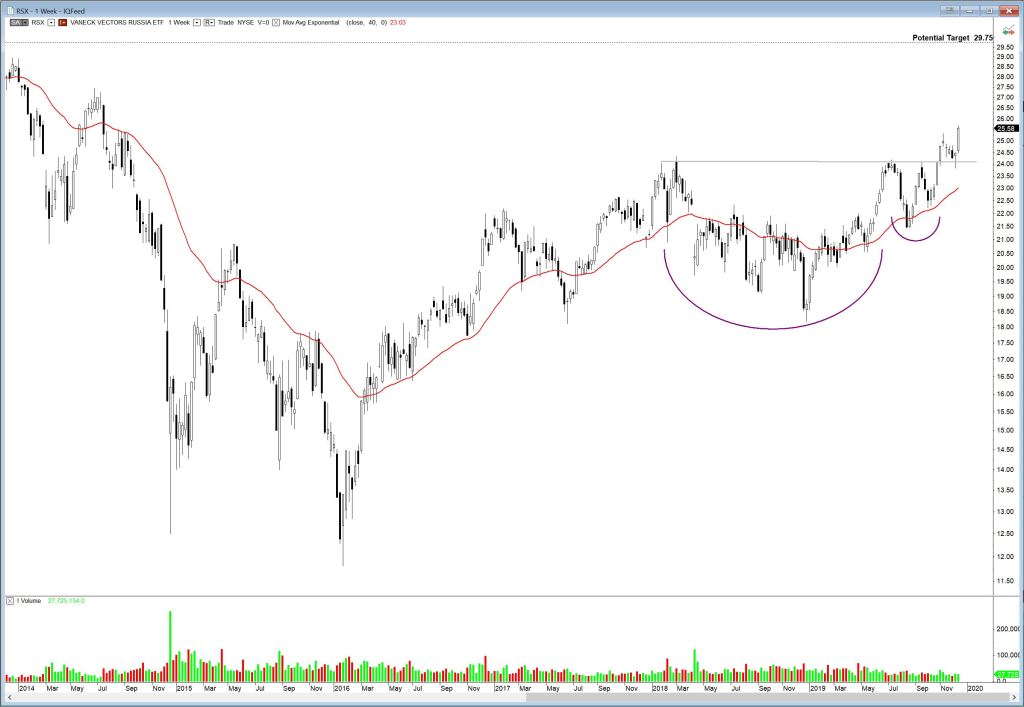
The Vaneck Vectors Russia ETF, RSX, has formed a very civilized looking cup and handle pattern. Breakout occurred the first week of November, followed by a retracement back to support, and then a bounce to the current price of 25.58. Possible target is 29.75.
Commodity Futures
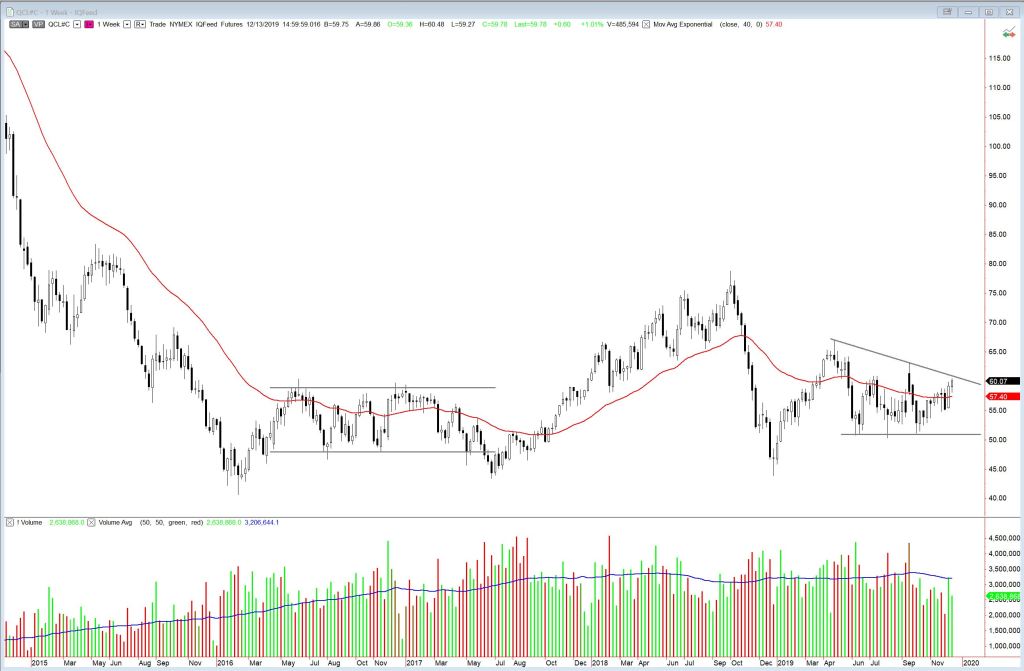
I don’t trade futures much, but I do keep an eye on them and will take the occasional trade. Crude is forming a descending triangle, spending the majority of the time below the 40 week EMA. At present it is challenging the upper boundary of the triangle. ETFs USO and UCO look similar.
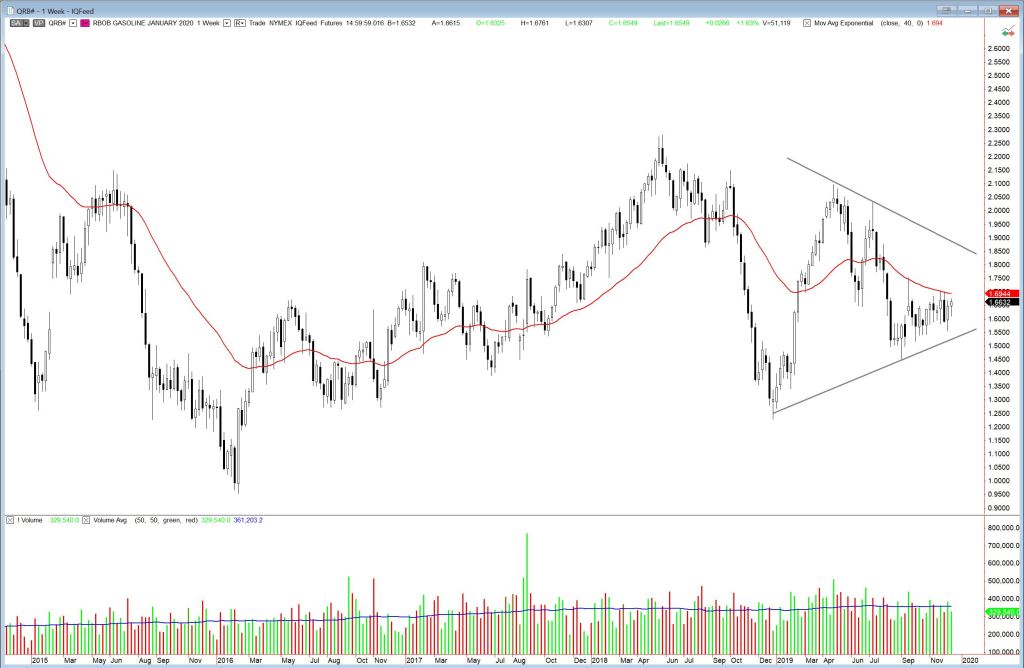
Gasoline looks weaker still, consolidating below the 40 week EMA in a symmetrical triangle. The upper boundary is poorly formed, as there have been no recent touches. Price seems to like the lower boundary of late.
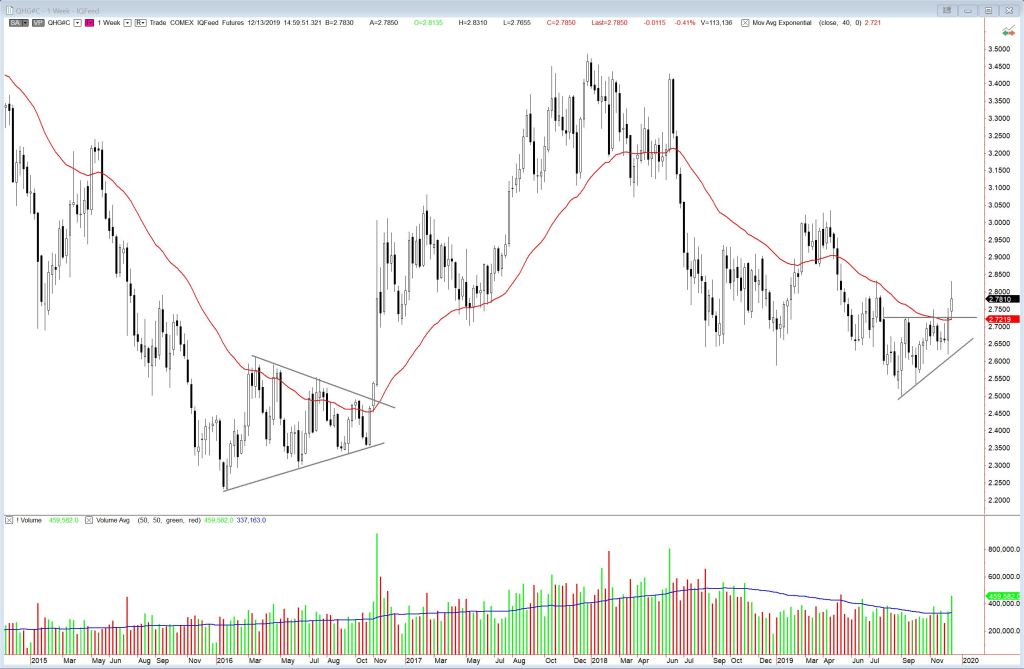
Copper broke out of a small ascending triangle this week, closing above the 40 week EMA, and settled at 2.781. Upside target is in the 2.9 – 3.0 area. Metals and mining, represented by the ETF XME, have also broken out. Likely in anticipation of positive movement in the US/China trade negotiations, which experienced a bit of an icebreaker moment this week. (Disclosure – I currently hold a position in HG futures. HG is quite volatile.)
Stocks
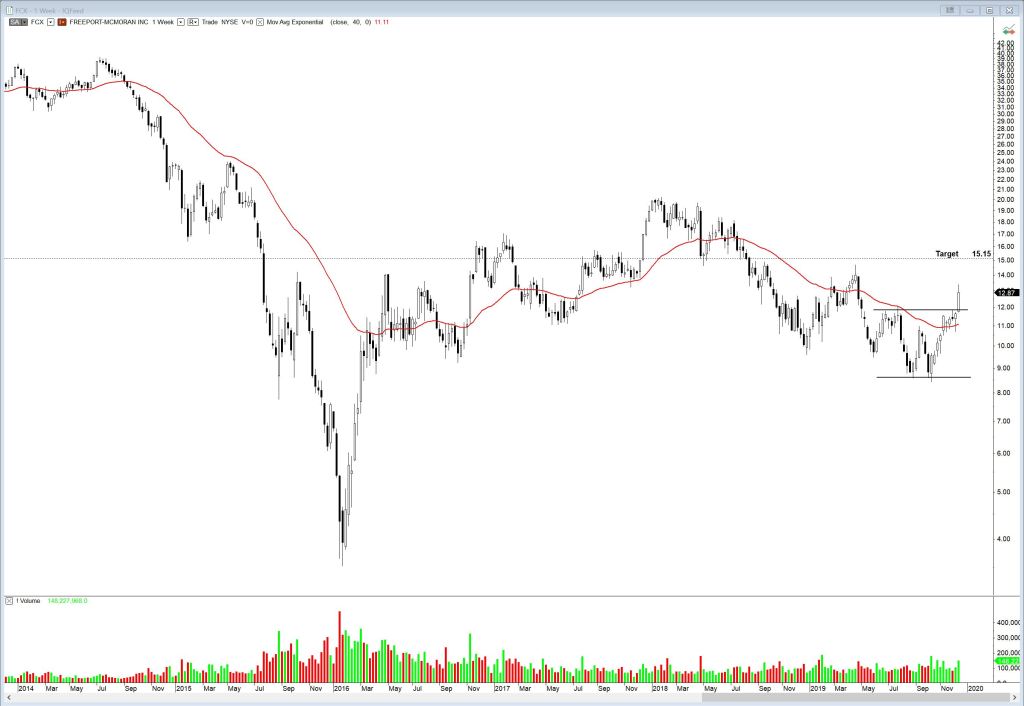
Continuing that line of thought, have a look at Freeport-McMoRan, FCX, which broke out strongly this week, moving above the rectangle and pushing further above the 40 week EMA. Note that these metal stocks can be volatile and risky. You don’t want to liquidate Grandma’s annuity and sink it in these, and to some degree they fall into the bottom-fishing category. But for those with an appetite for risk, they are worth a look. (Disclosure – I currently hold a small position in FCX)
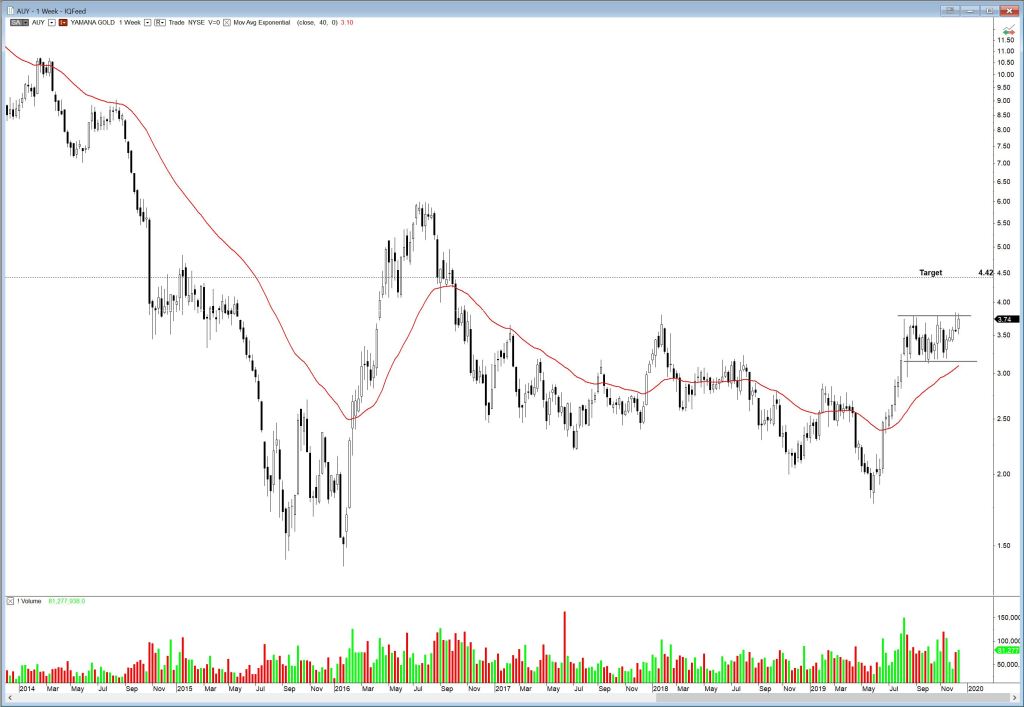
Yamana Gold, AUY, has rallied strongly and is consolidating in a rectangle above the 40 week EMA.
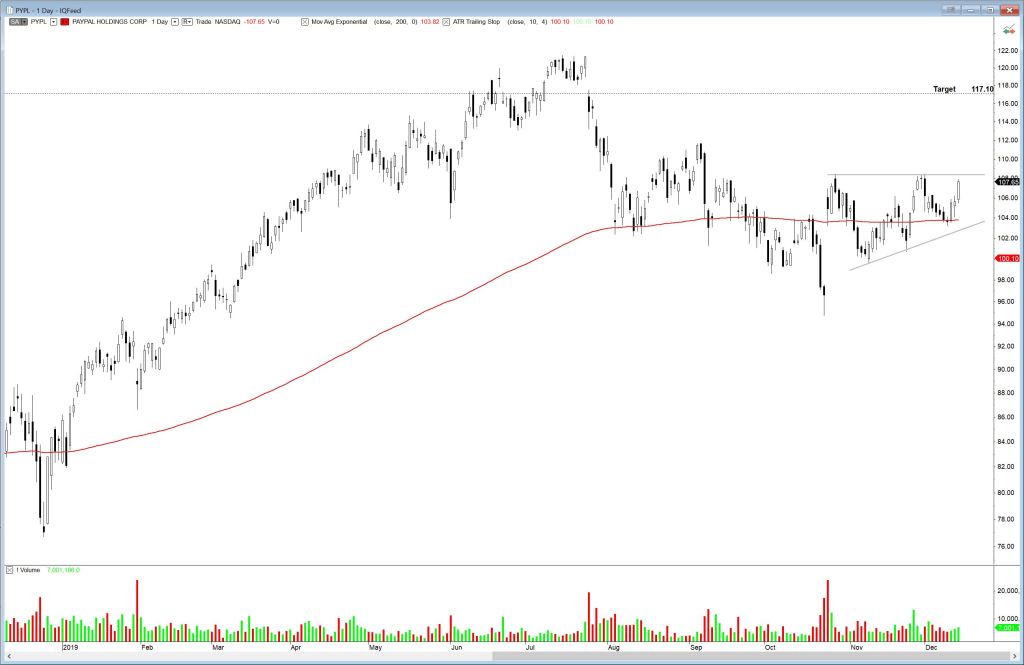
Finally, Paypal, PYPL, is consolidating in an ascending triangle on the daily scale (not weekly, it’s a bit small to see on that scale). It recently bounced off the 40 week EMA and is challenging the upper boundary of the triangle. If it can break out and join the market rally, it could reach a possible target of 117.10.